No items found.
Create, share, and discuss reports collaboratively. Leverage Power BI's reporting capabilities to enhance data-driven decision-making and foster a collaborative reporting environment.
Talk to an Expert The Microsoft Power BI data analytics module is specifically geared towards teaching students how to use Microsoft Power BI software for data analytics. Power BI is a popular business intelligence tool crafted by Microsoft, dedicated to data visualization. Its primary function is to enable users to make secure connections with various data streams, mold and rectify the data, and subsequently create engaging visualizations and reports.
This module delves deep into all the functionalities that Power BI provides for data analytics. The focus is on understanding and teaching crucial topics like data modeling, data transformation, making visualizations, and generating powerful reports.
Participants will understand the process of harnessing Power BI to connect to different data sources successfully.
Power Query, a powerful tool in Excel and the Power BI Desktop application, enables users to discover, connect, combine, and refine data across a wide variety of sources. Students will learn to use Power Query and its advanced functionalities for data cleansing and transformation.
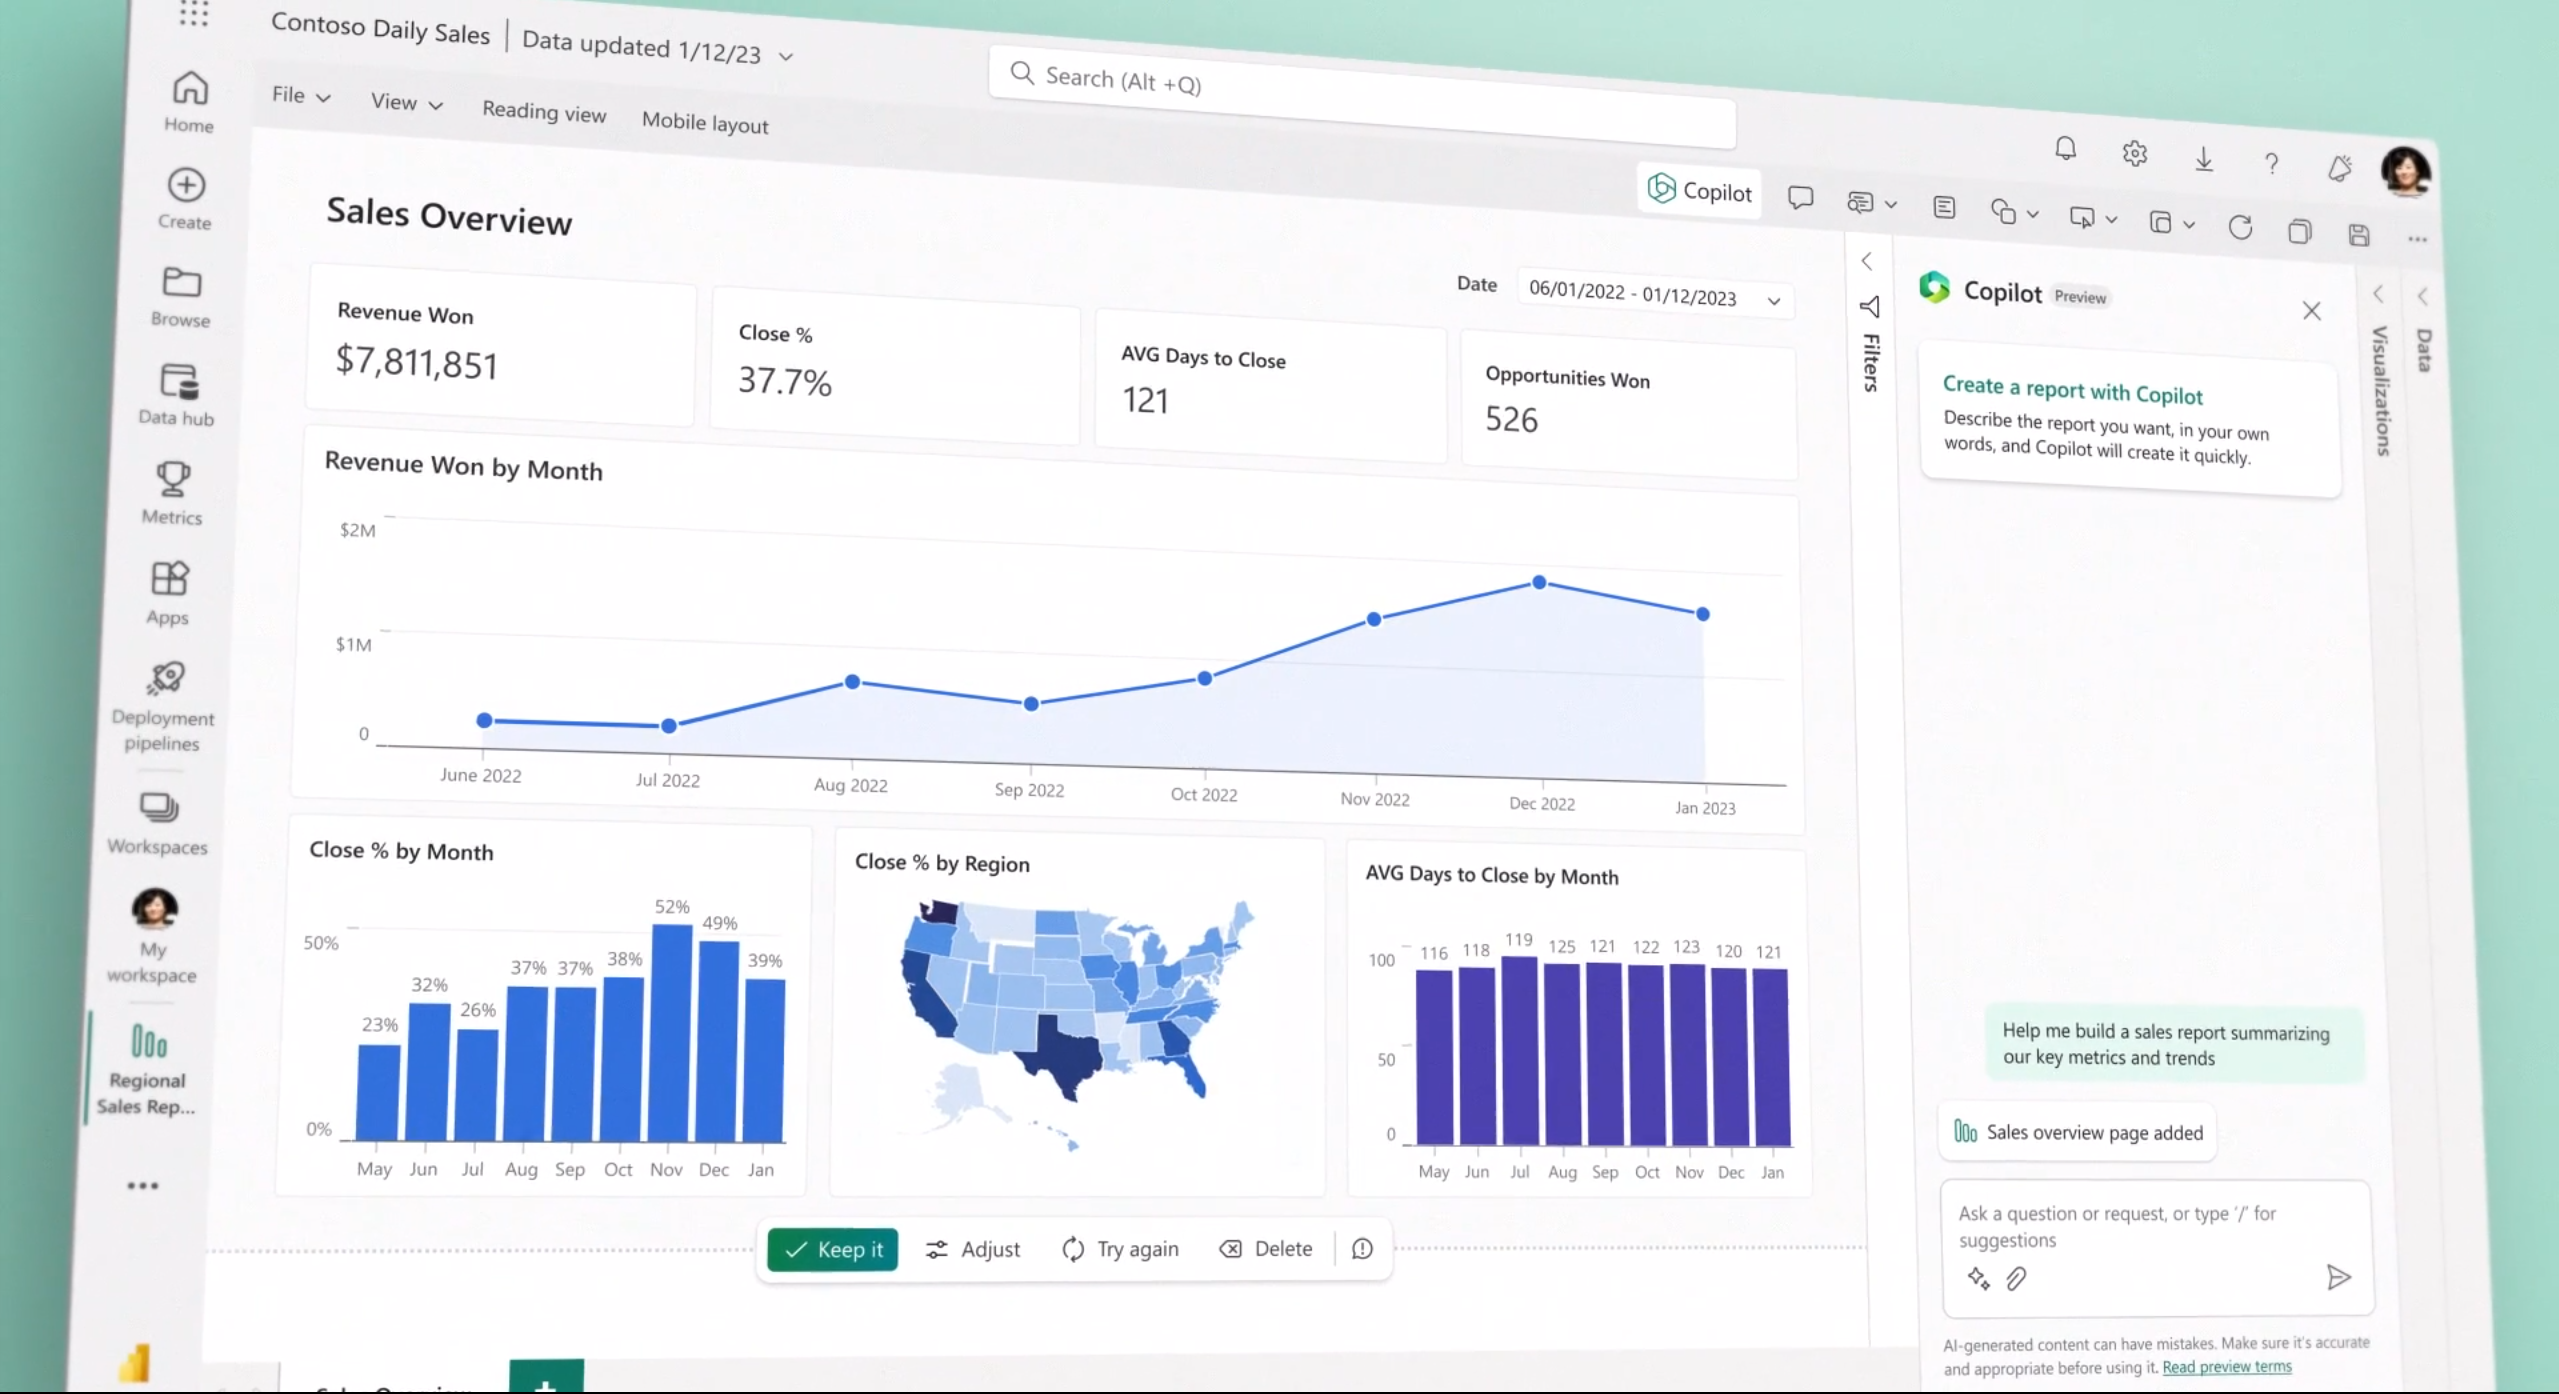
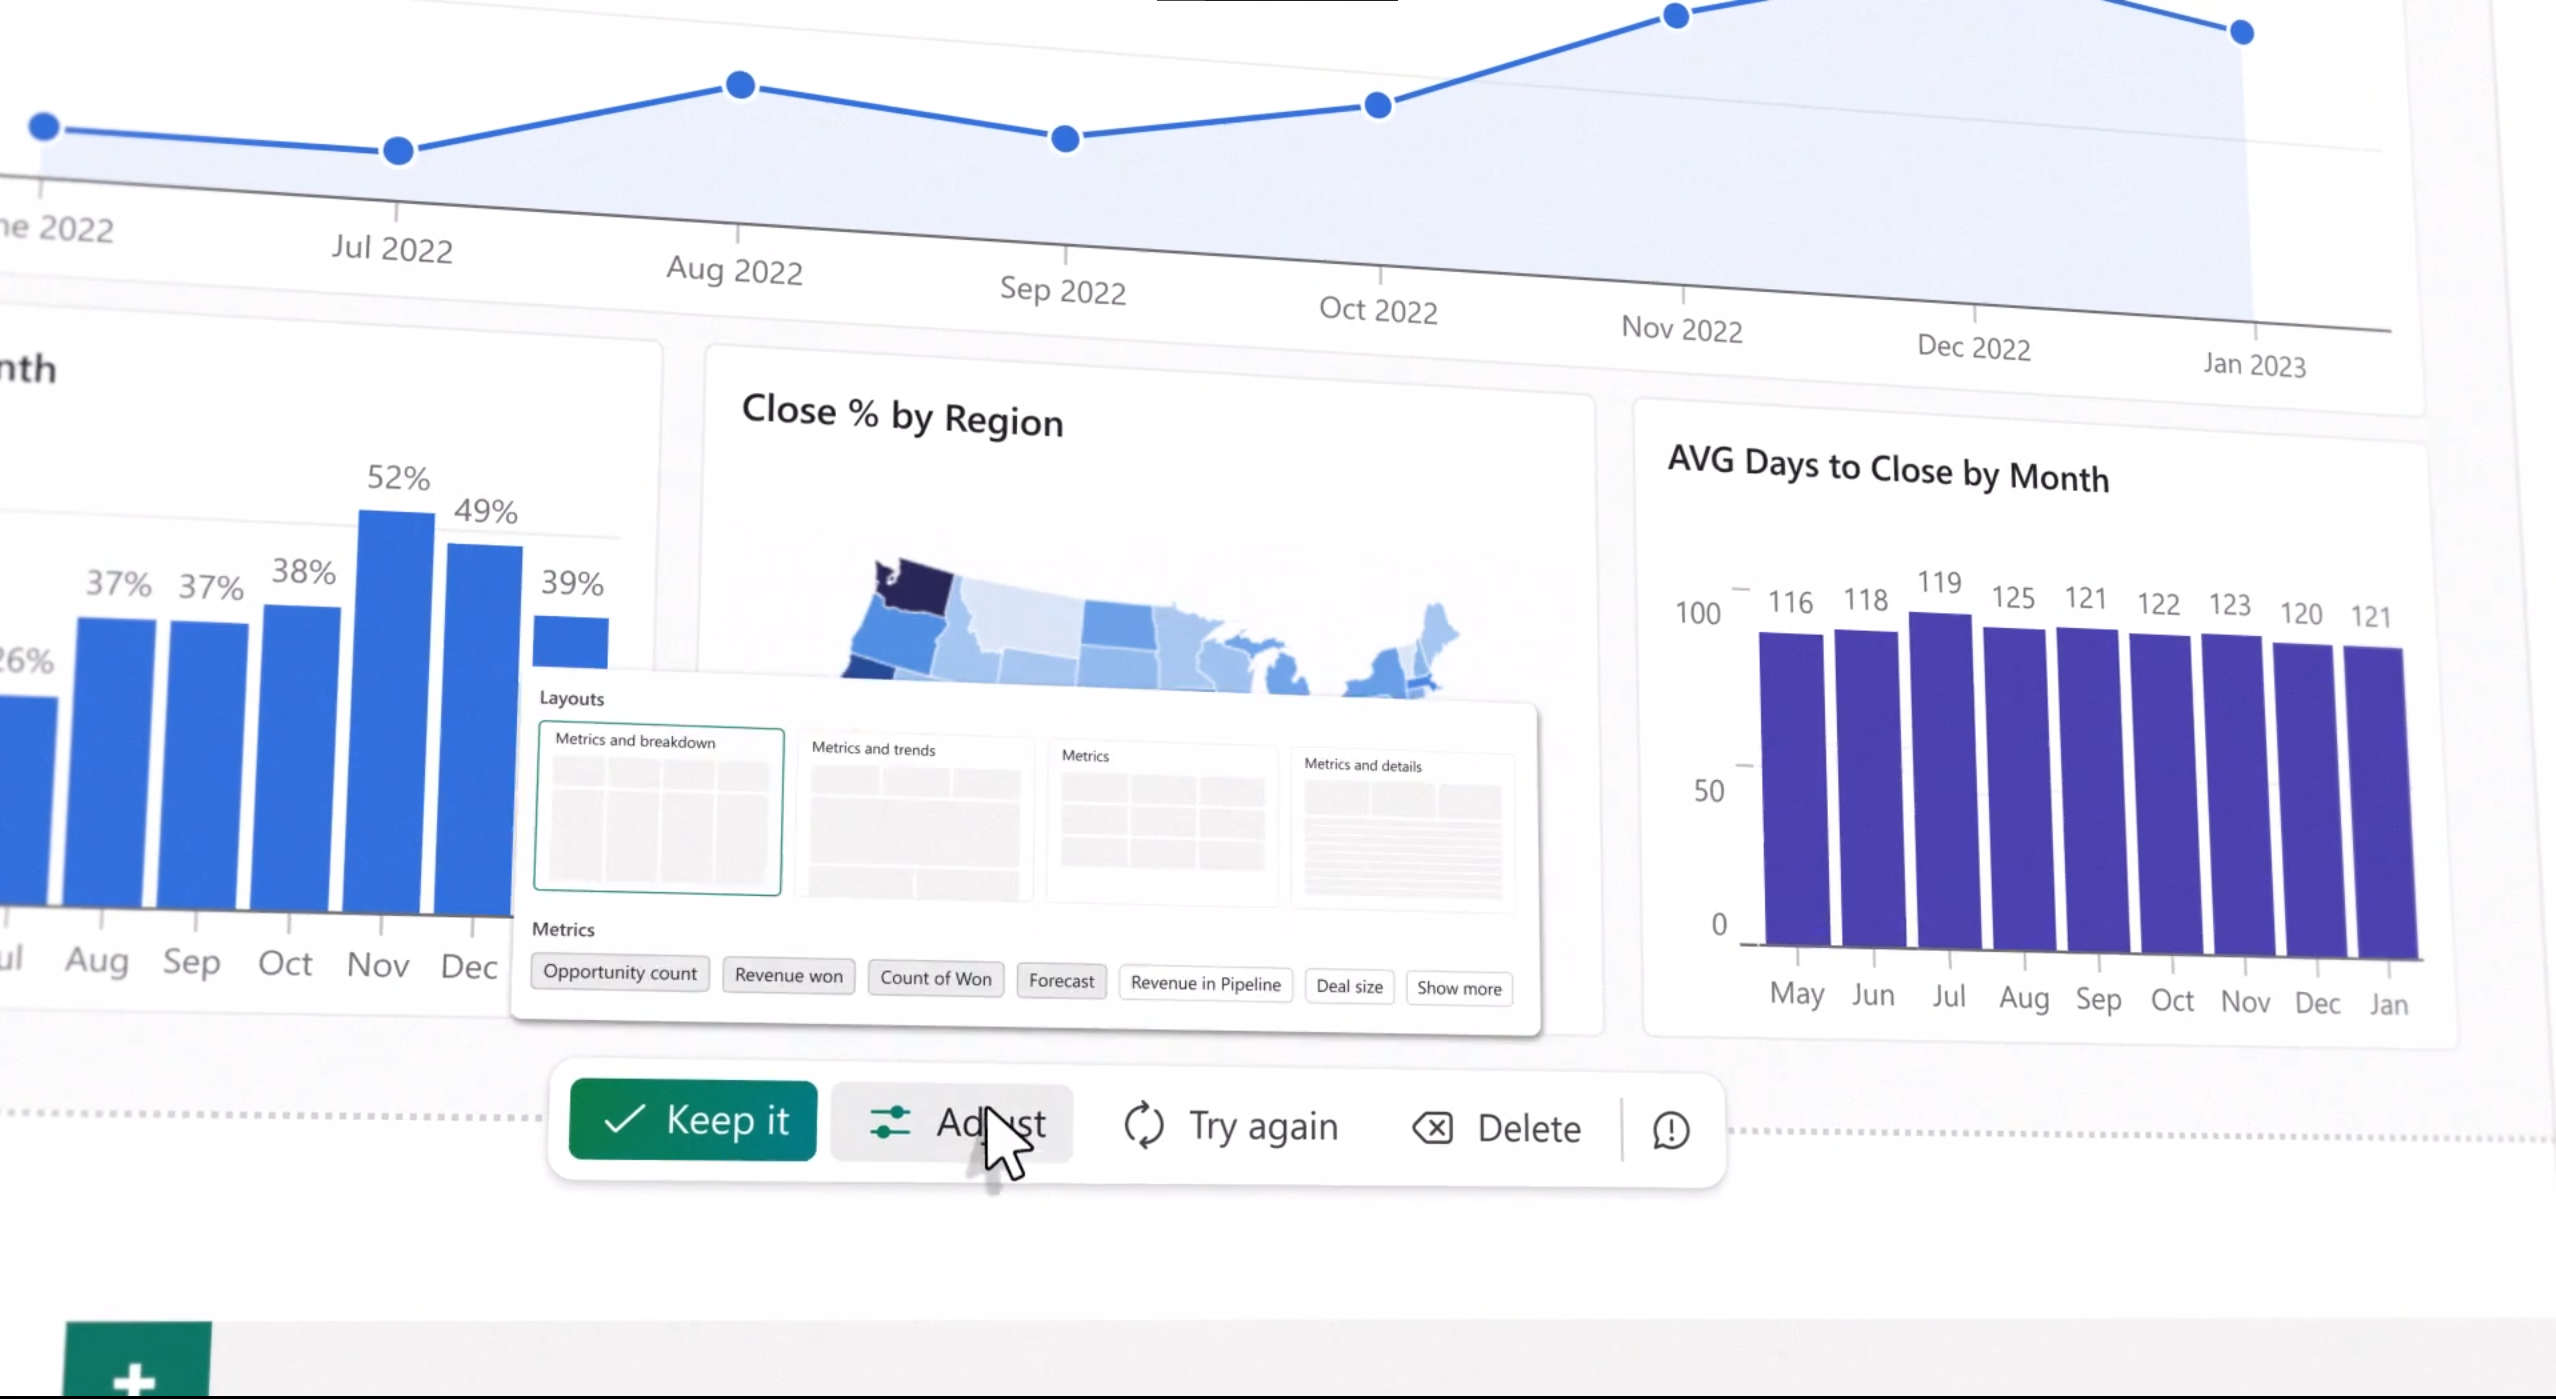
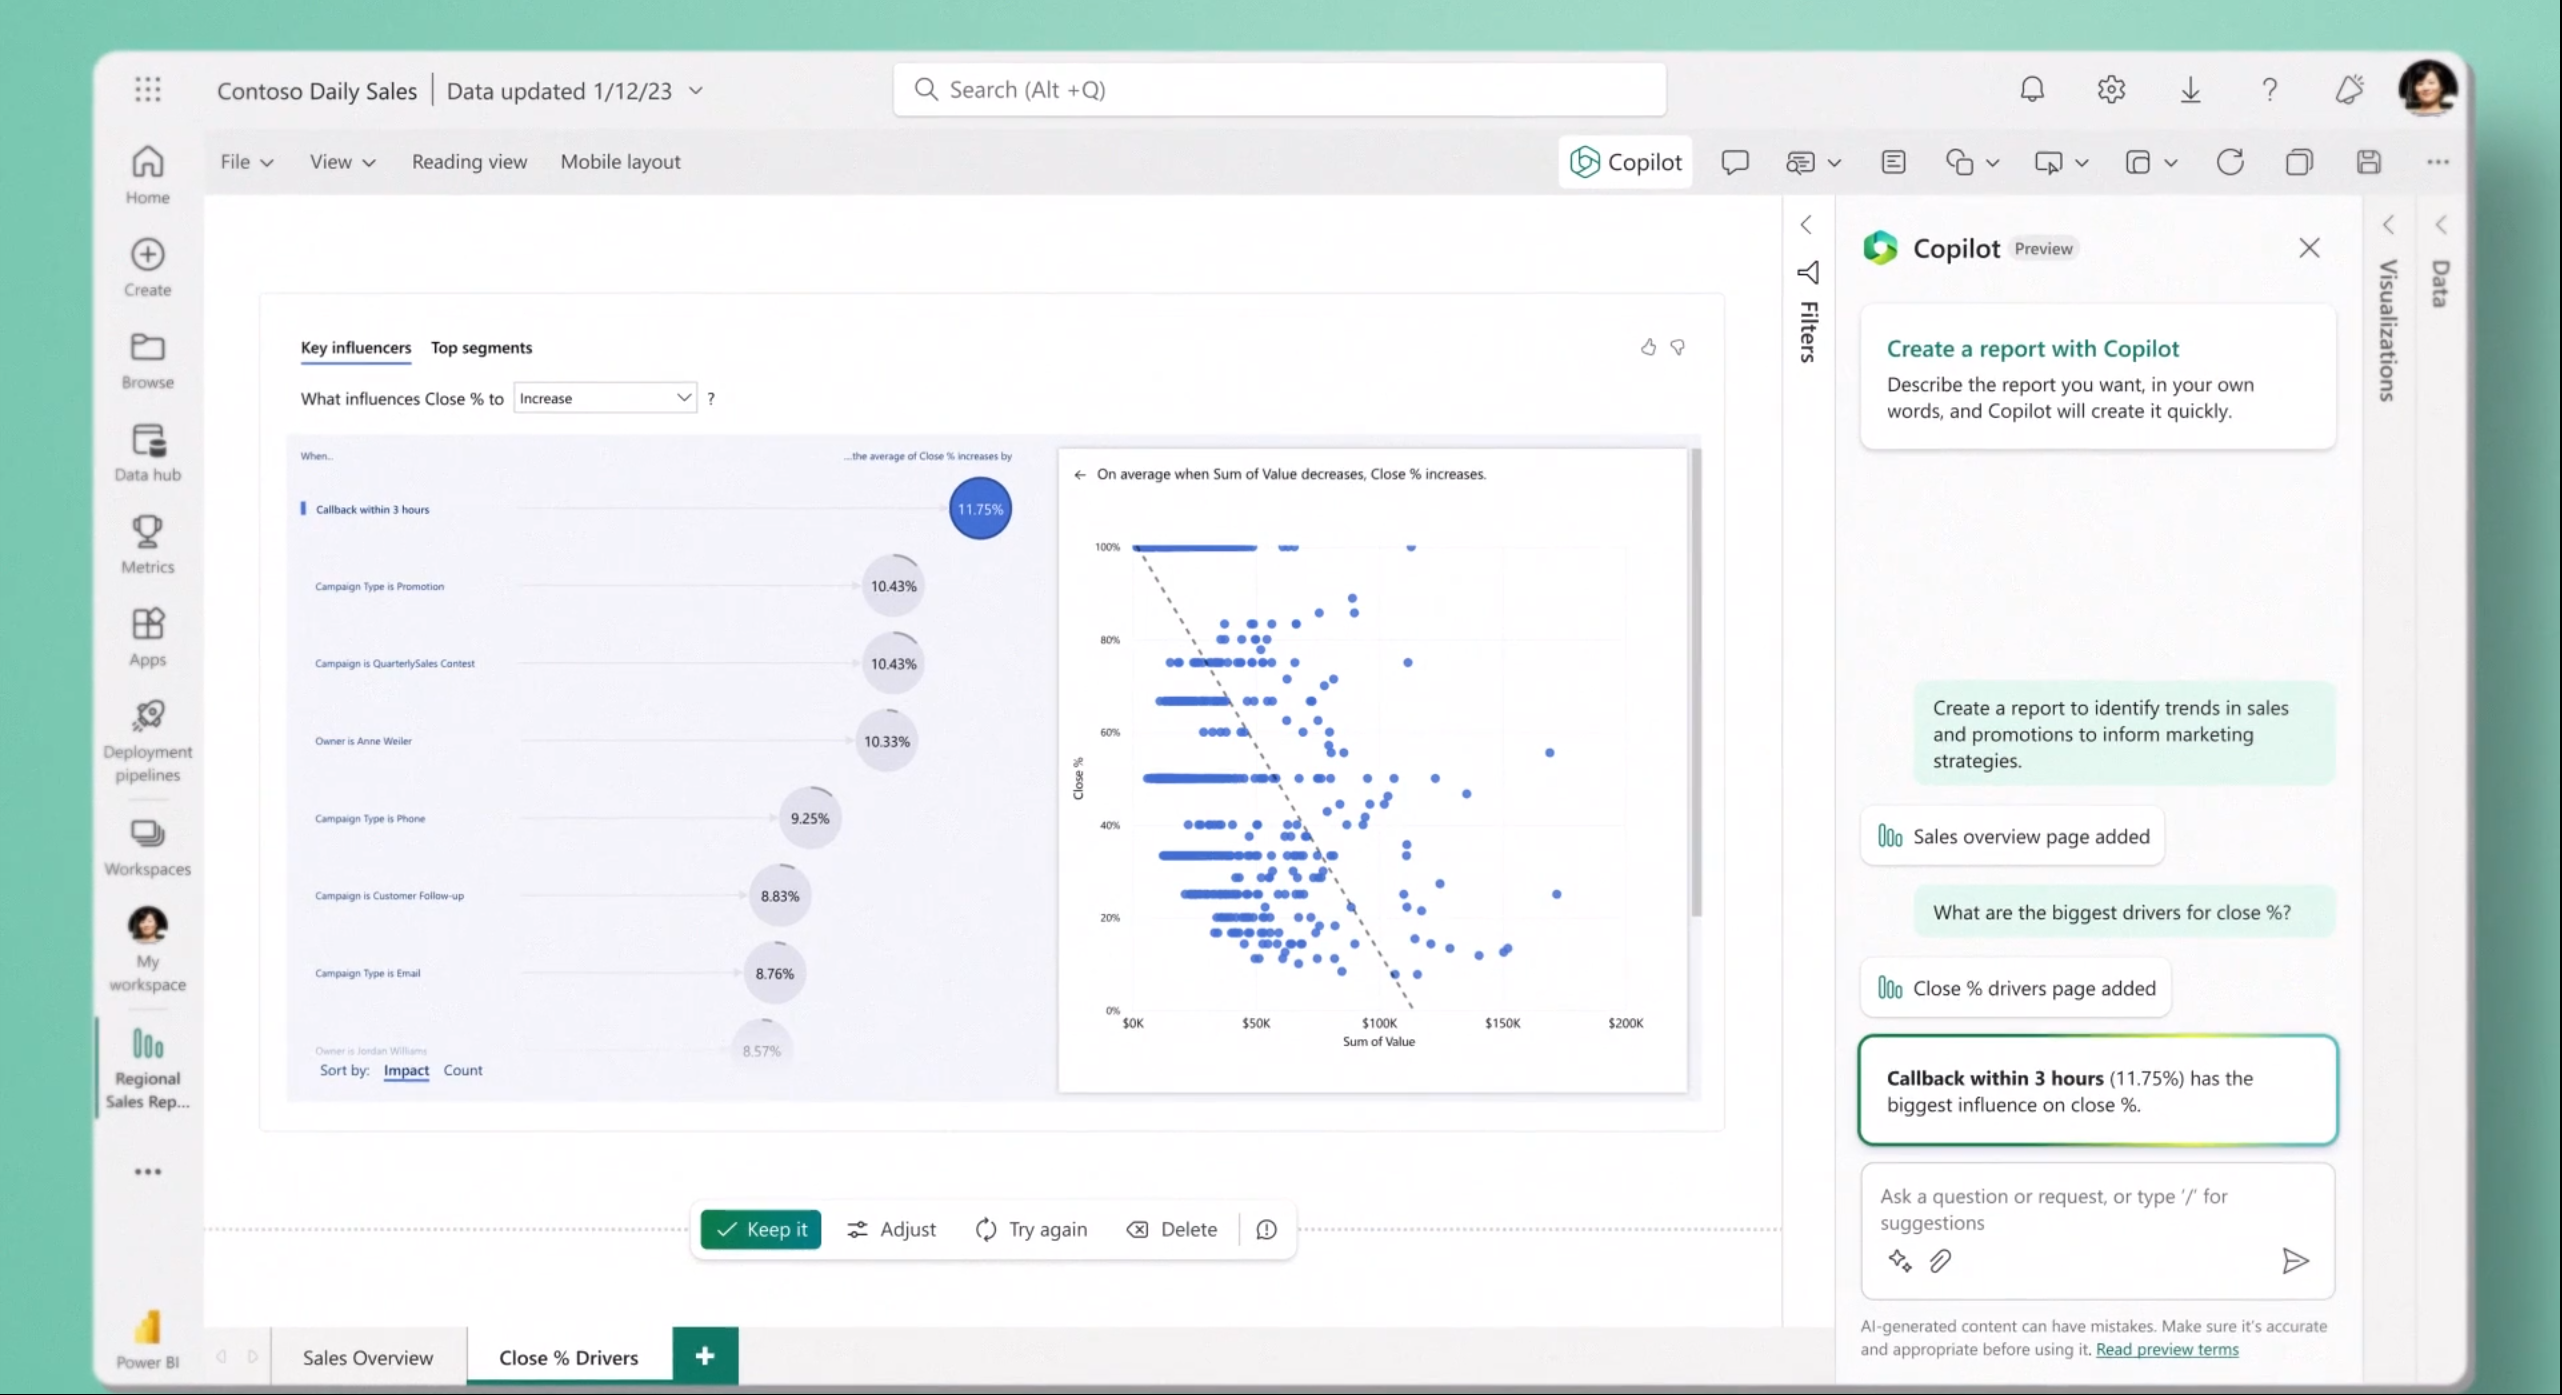
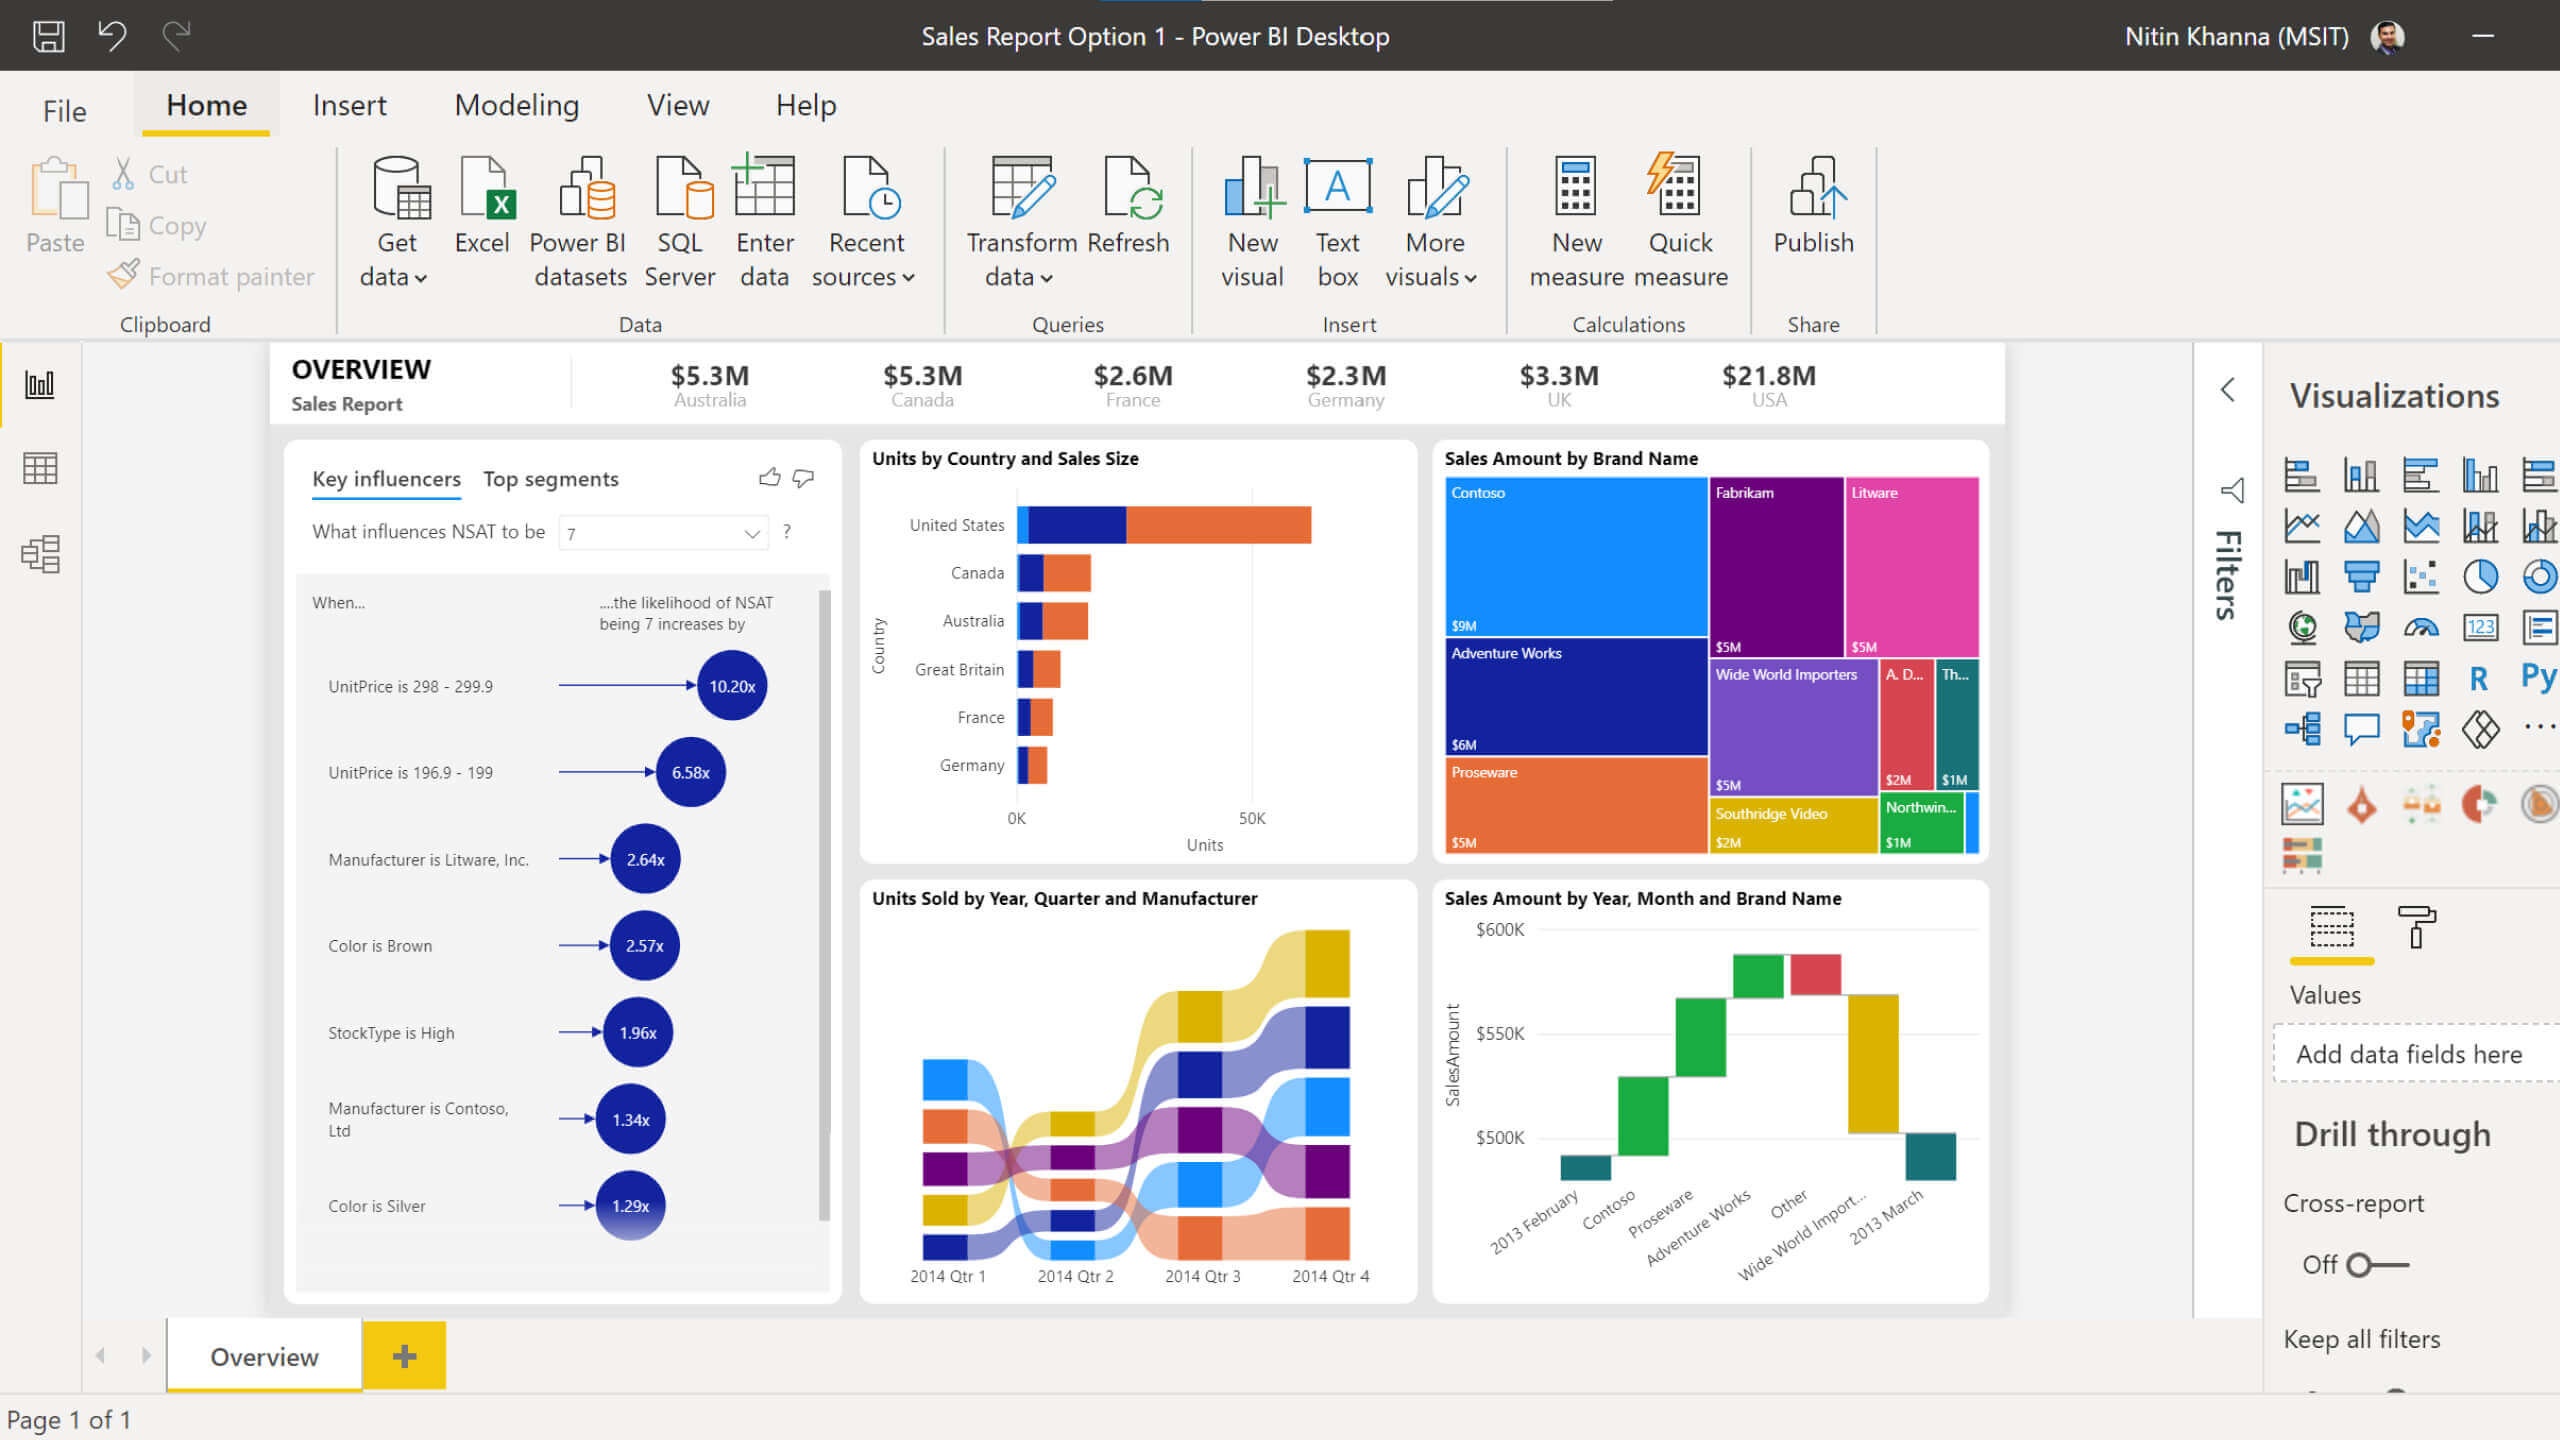
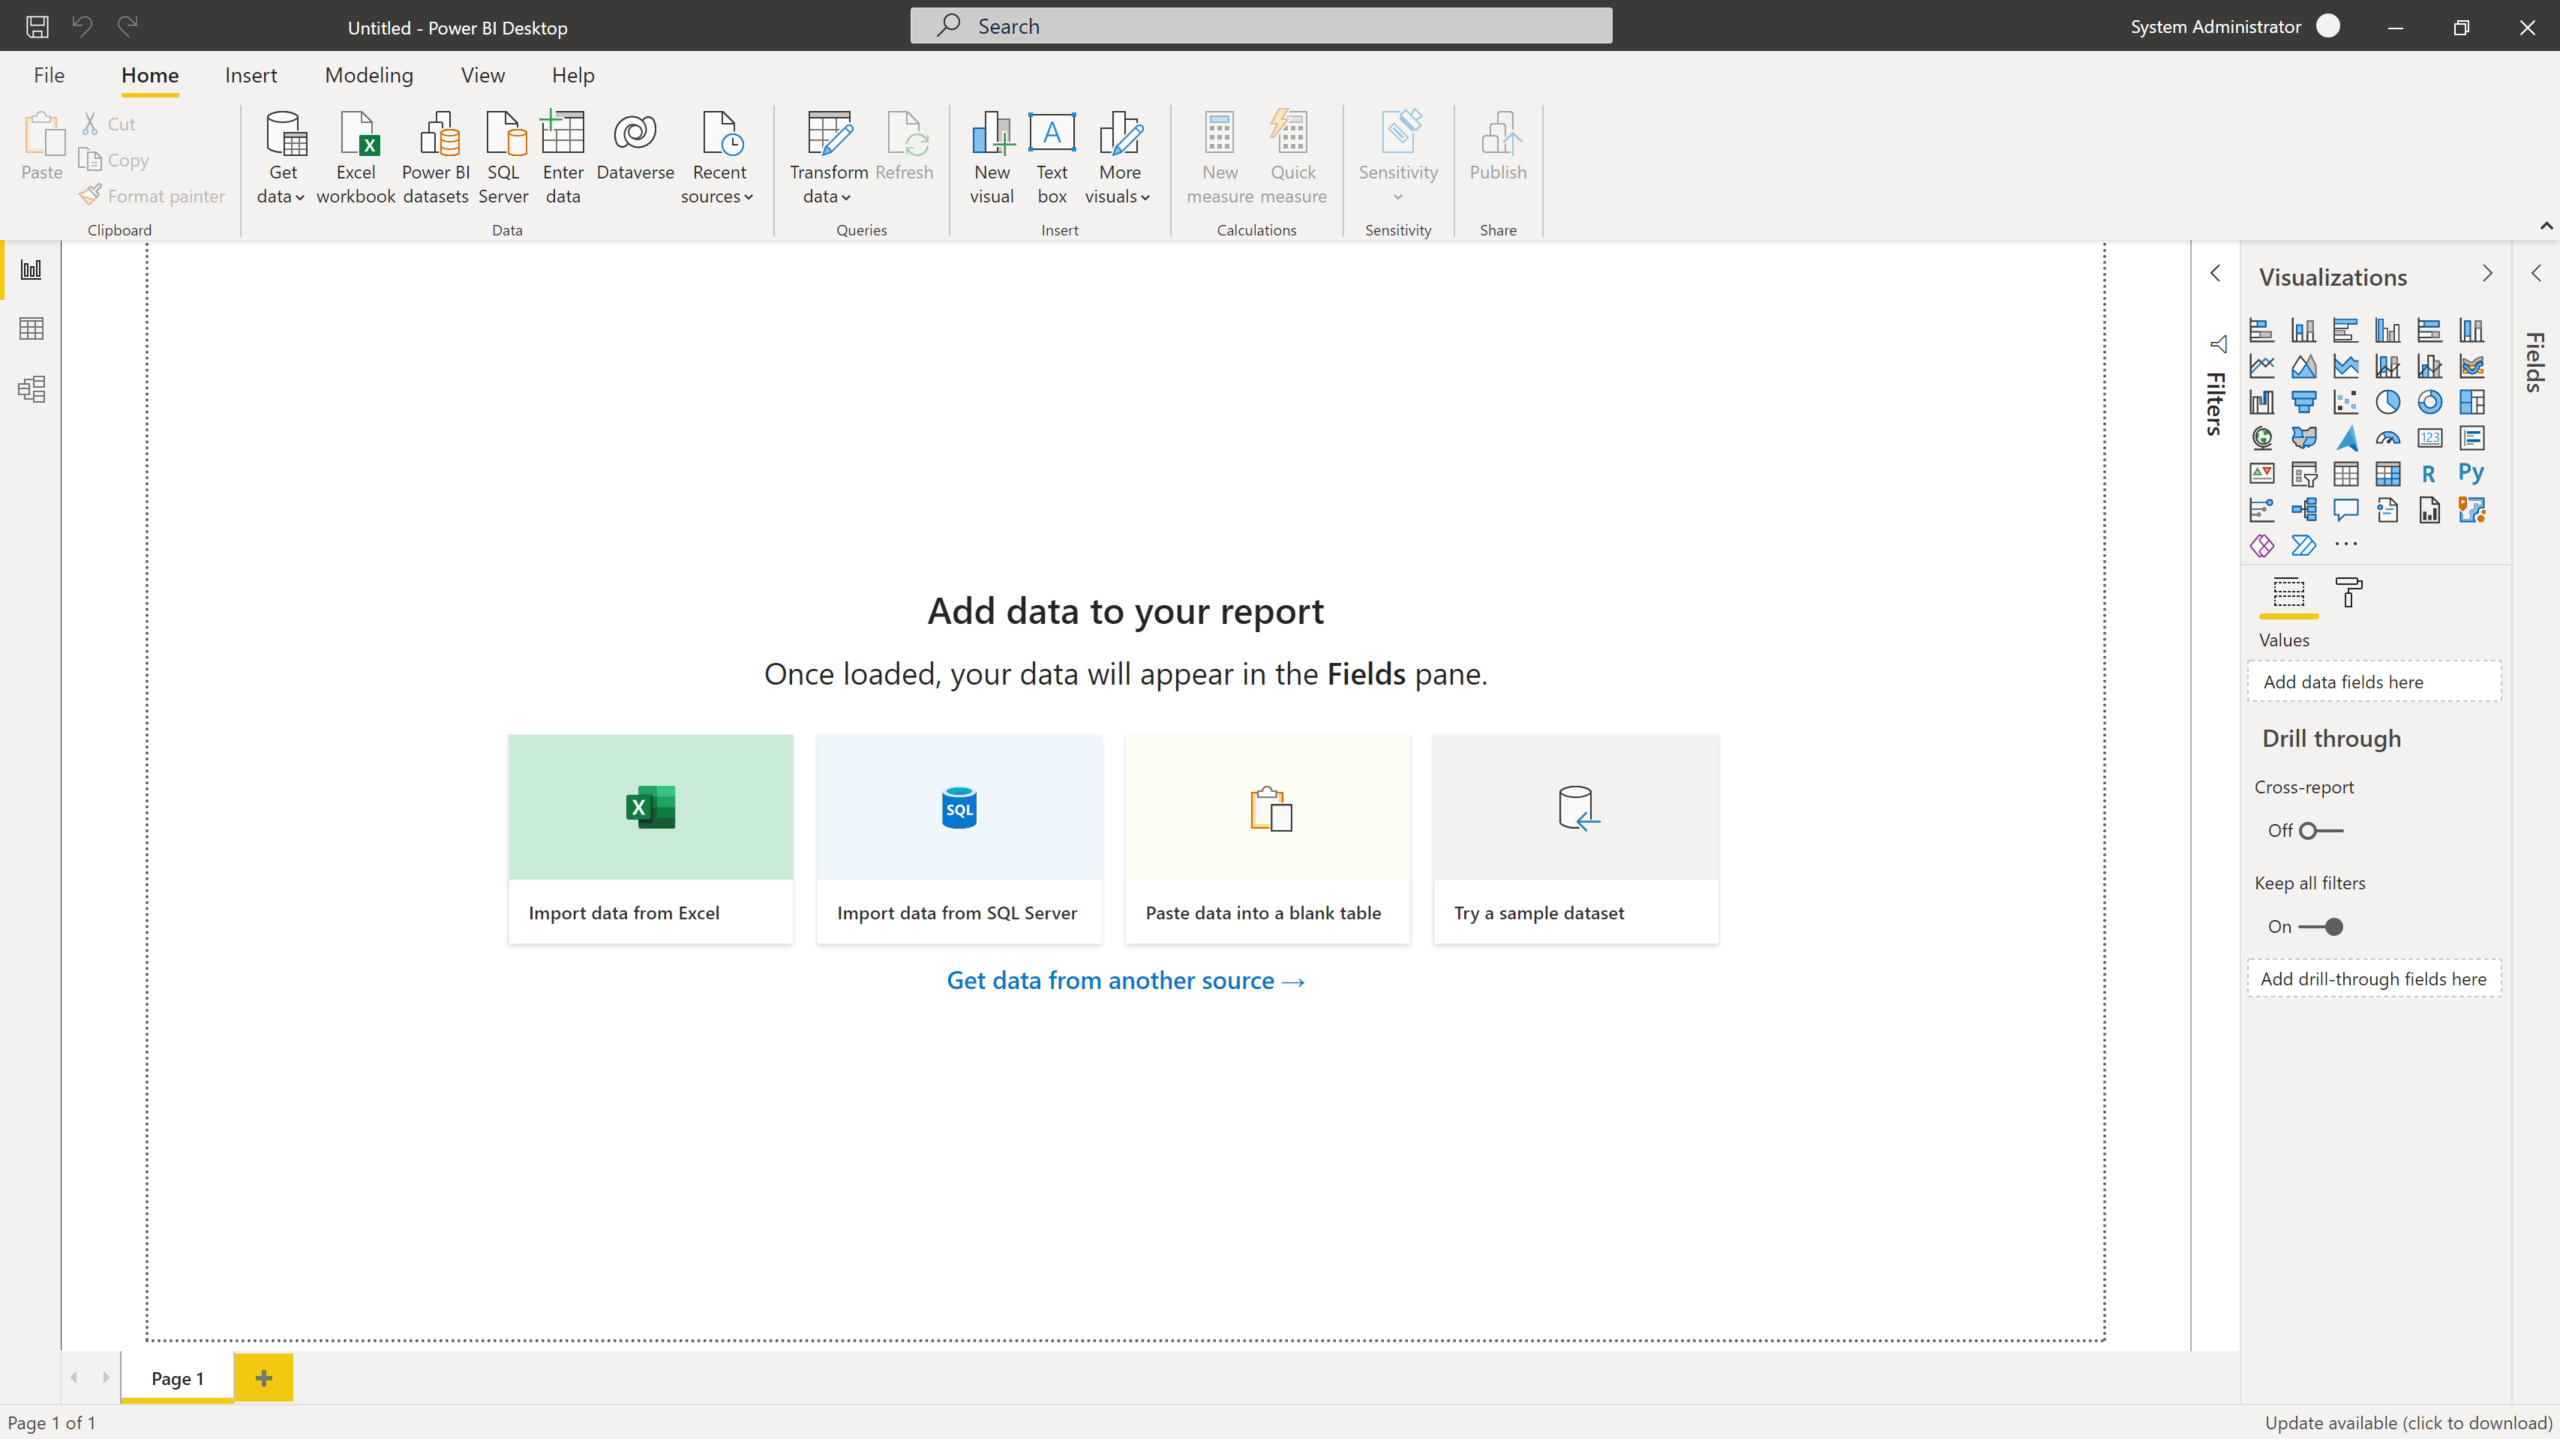
The students will learn to make the best use of Power BI Desktop, a visual data exploration tool, to create highly interactive dashboards and reports that provide actionable business insights.
Data Analysis Expressions (DAX) is a formula expression language used in Power BI. It enables users to define custom calculations in calculated columns and measures. The module covers the implementation of this advanced feature, aiding students in better comprehension of their data.
Row-level security (RLS) limits data access at the row level based on filters that you define in Power BI Desktop. The module gives detailed insights into how to incorporate RLS, ensuring the access to the data is permitted only to those who are authorized.
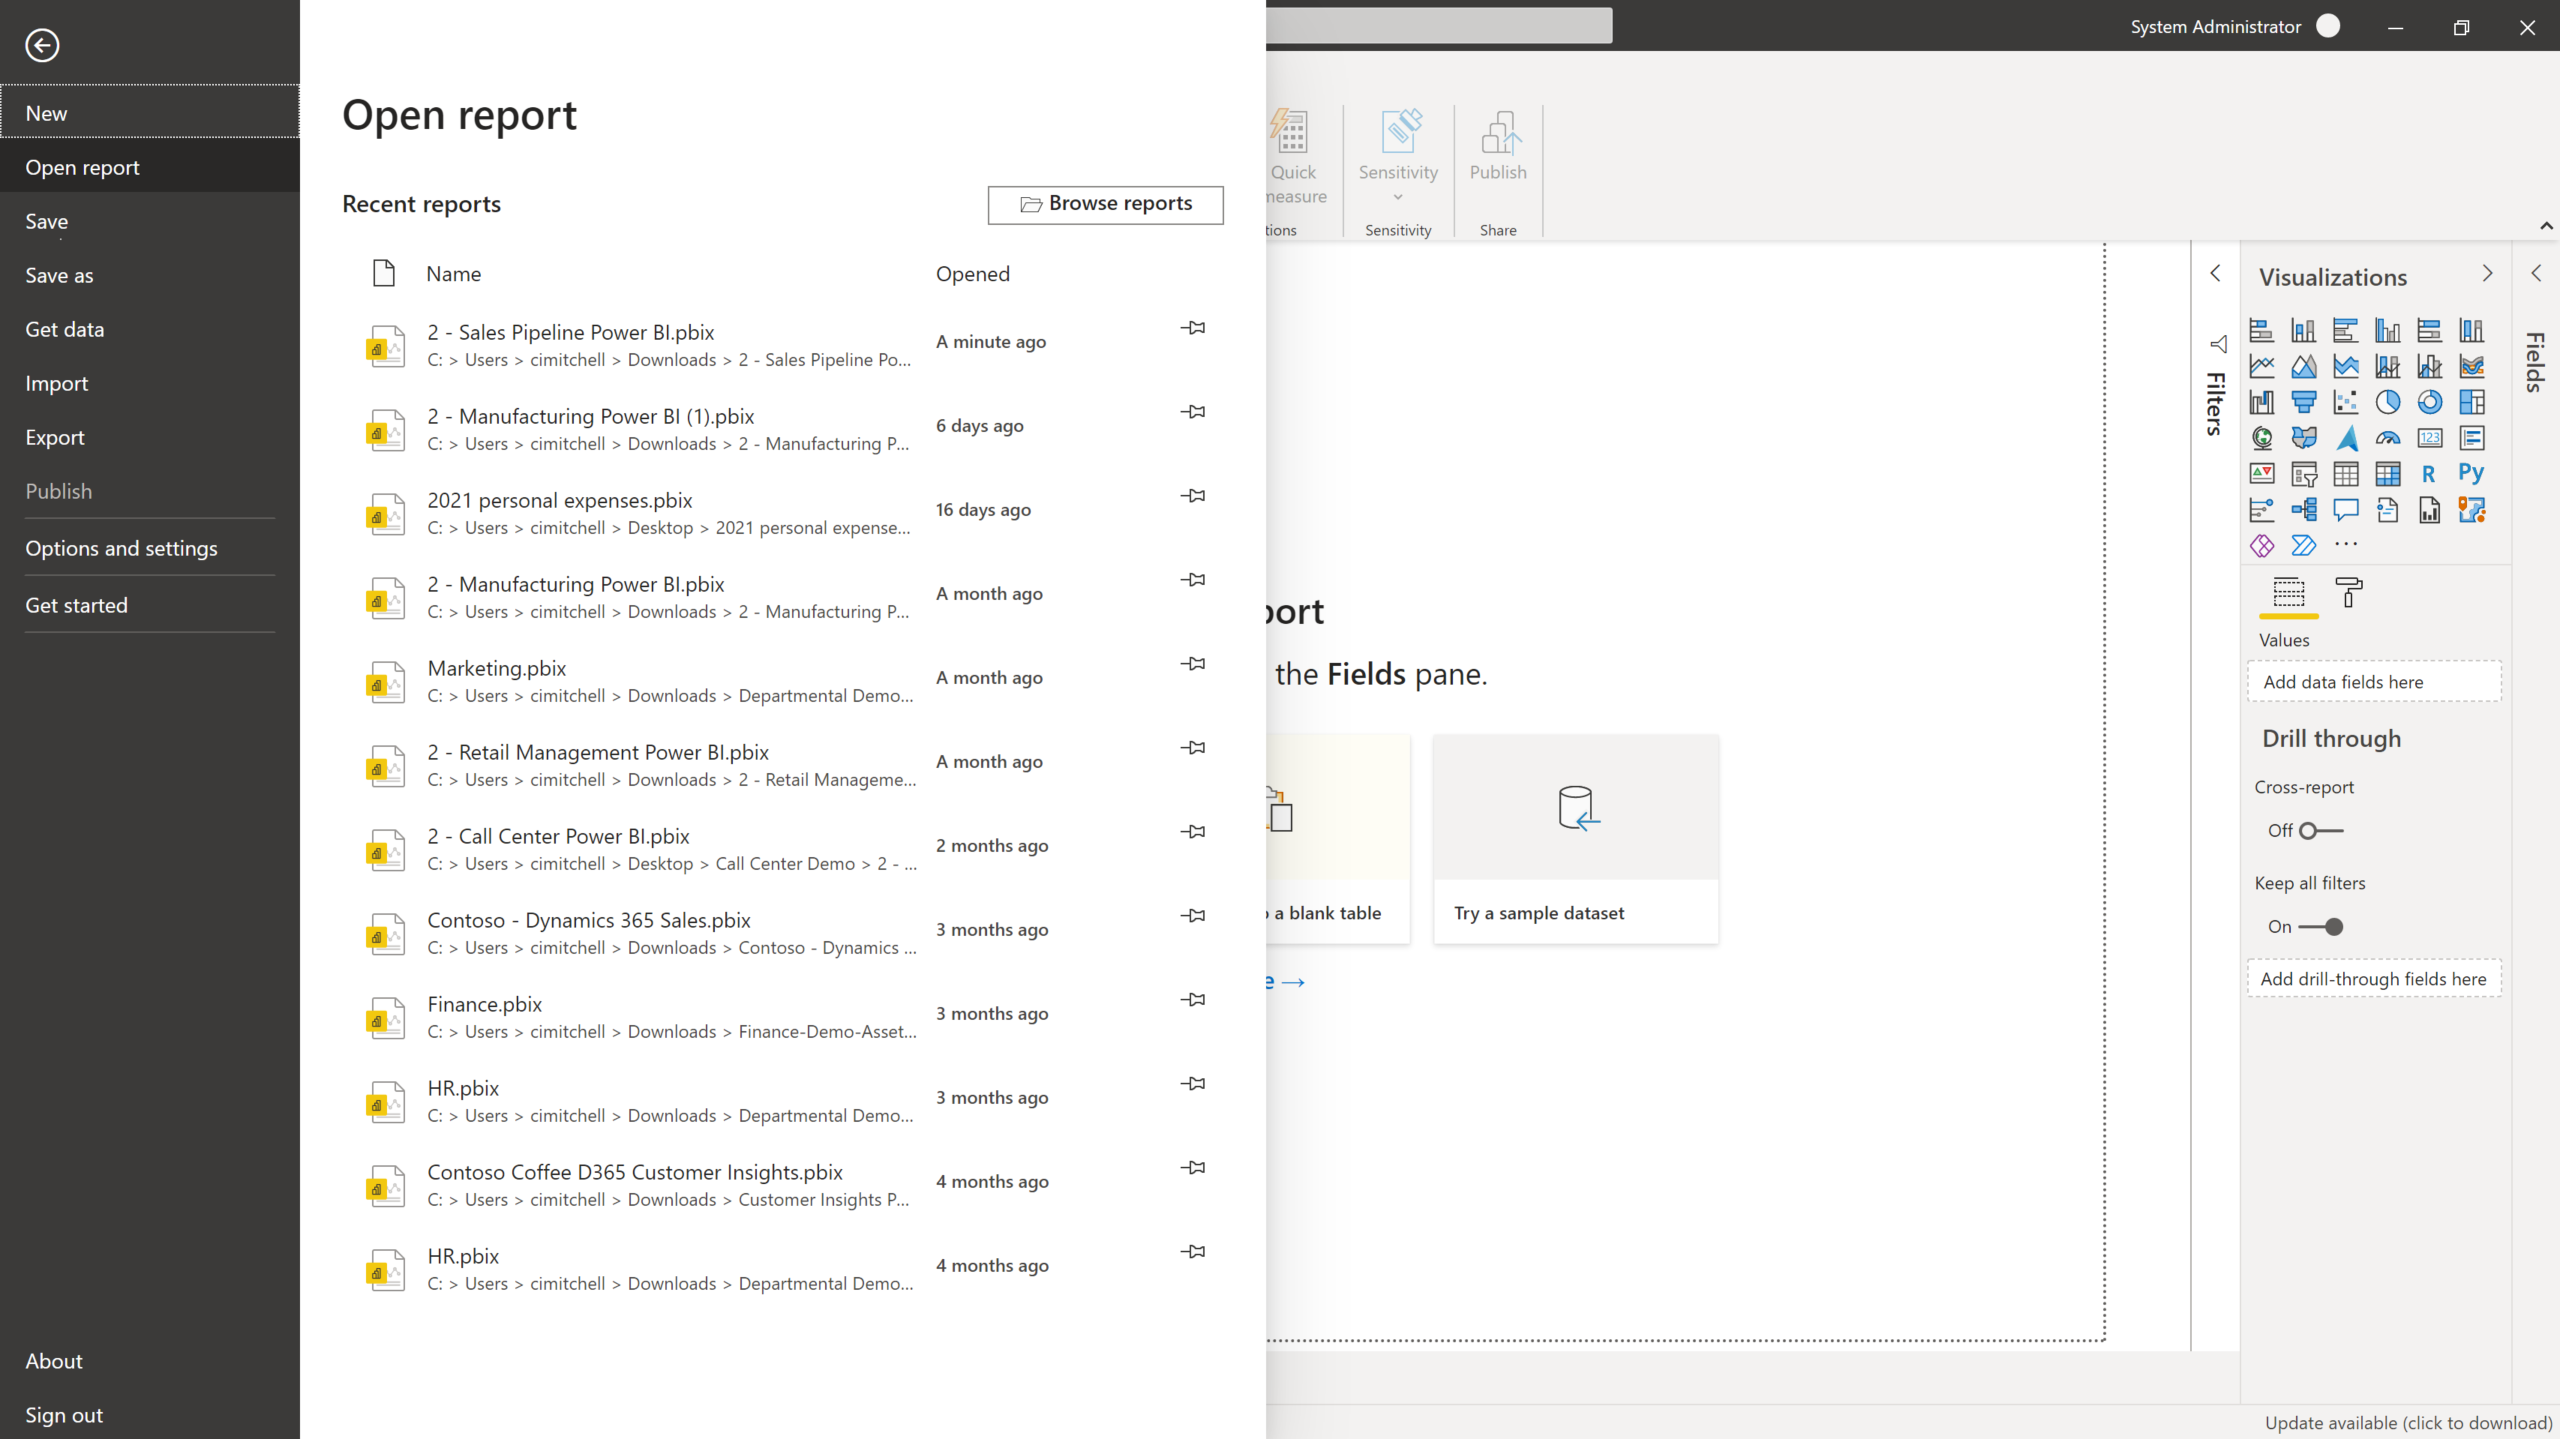
The ubiquitous Power BI service aids in publishing and sharing reports. The module will teach students how to leverage Power BI service for widespread distribution of their reports.
By the end of the Microsoft Power BI Data Analytics Module, students will have a holistic understanding of how to utilize Power BI for their data analytics needs.
Students will be adept in importing and molding data, enabling them to work with diverse data sources effectively.
The module equips students with the skills to create insightful visualizations that help in understanding complex data patterns and trends.
Students will learn to generate powerful reports that provide actionable business insights, enabling informed decision-making.
This module is an ideal fit for individuals seeking to enhance their data analysis skills and gain proficiency in using Power BI as a data analytics tool.
Students will learn how to share their discoveries with others, facilitating collaboration and knowledge sharing within their organization.