
No items found.
Elevate financial operations through advanced NetSuite solutions that optimize processes and enhance control over budgeting, reporting, and real-time insights for better financial management.
Talk to an Expert The Microsoft Power BI Data Visualization module provides an extensive exploratory journey into the sphere of using Microsoft Power BI for data visualization. This powerful business intelligence and data visualization tool offers the ability to connect to a multitude of data sources, undertake data transformations, and create interactive visualizations.
The module initiates learners with an introduction to Power BI and its multifaceted components, which embody Power BI Desktop, Power BI Service, and Power BI Mobile.
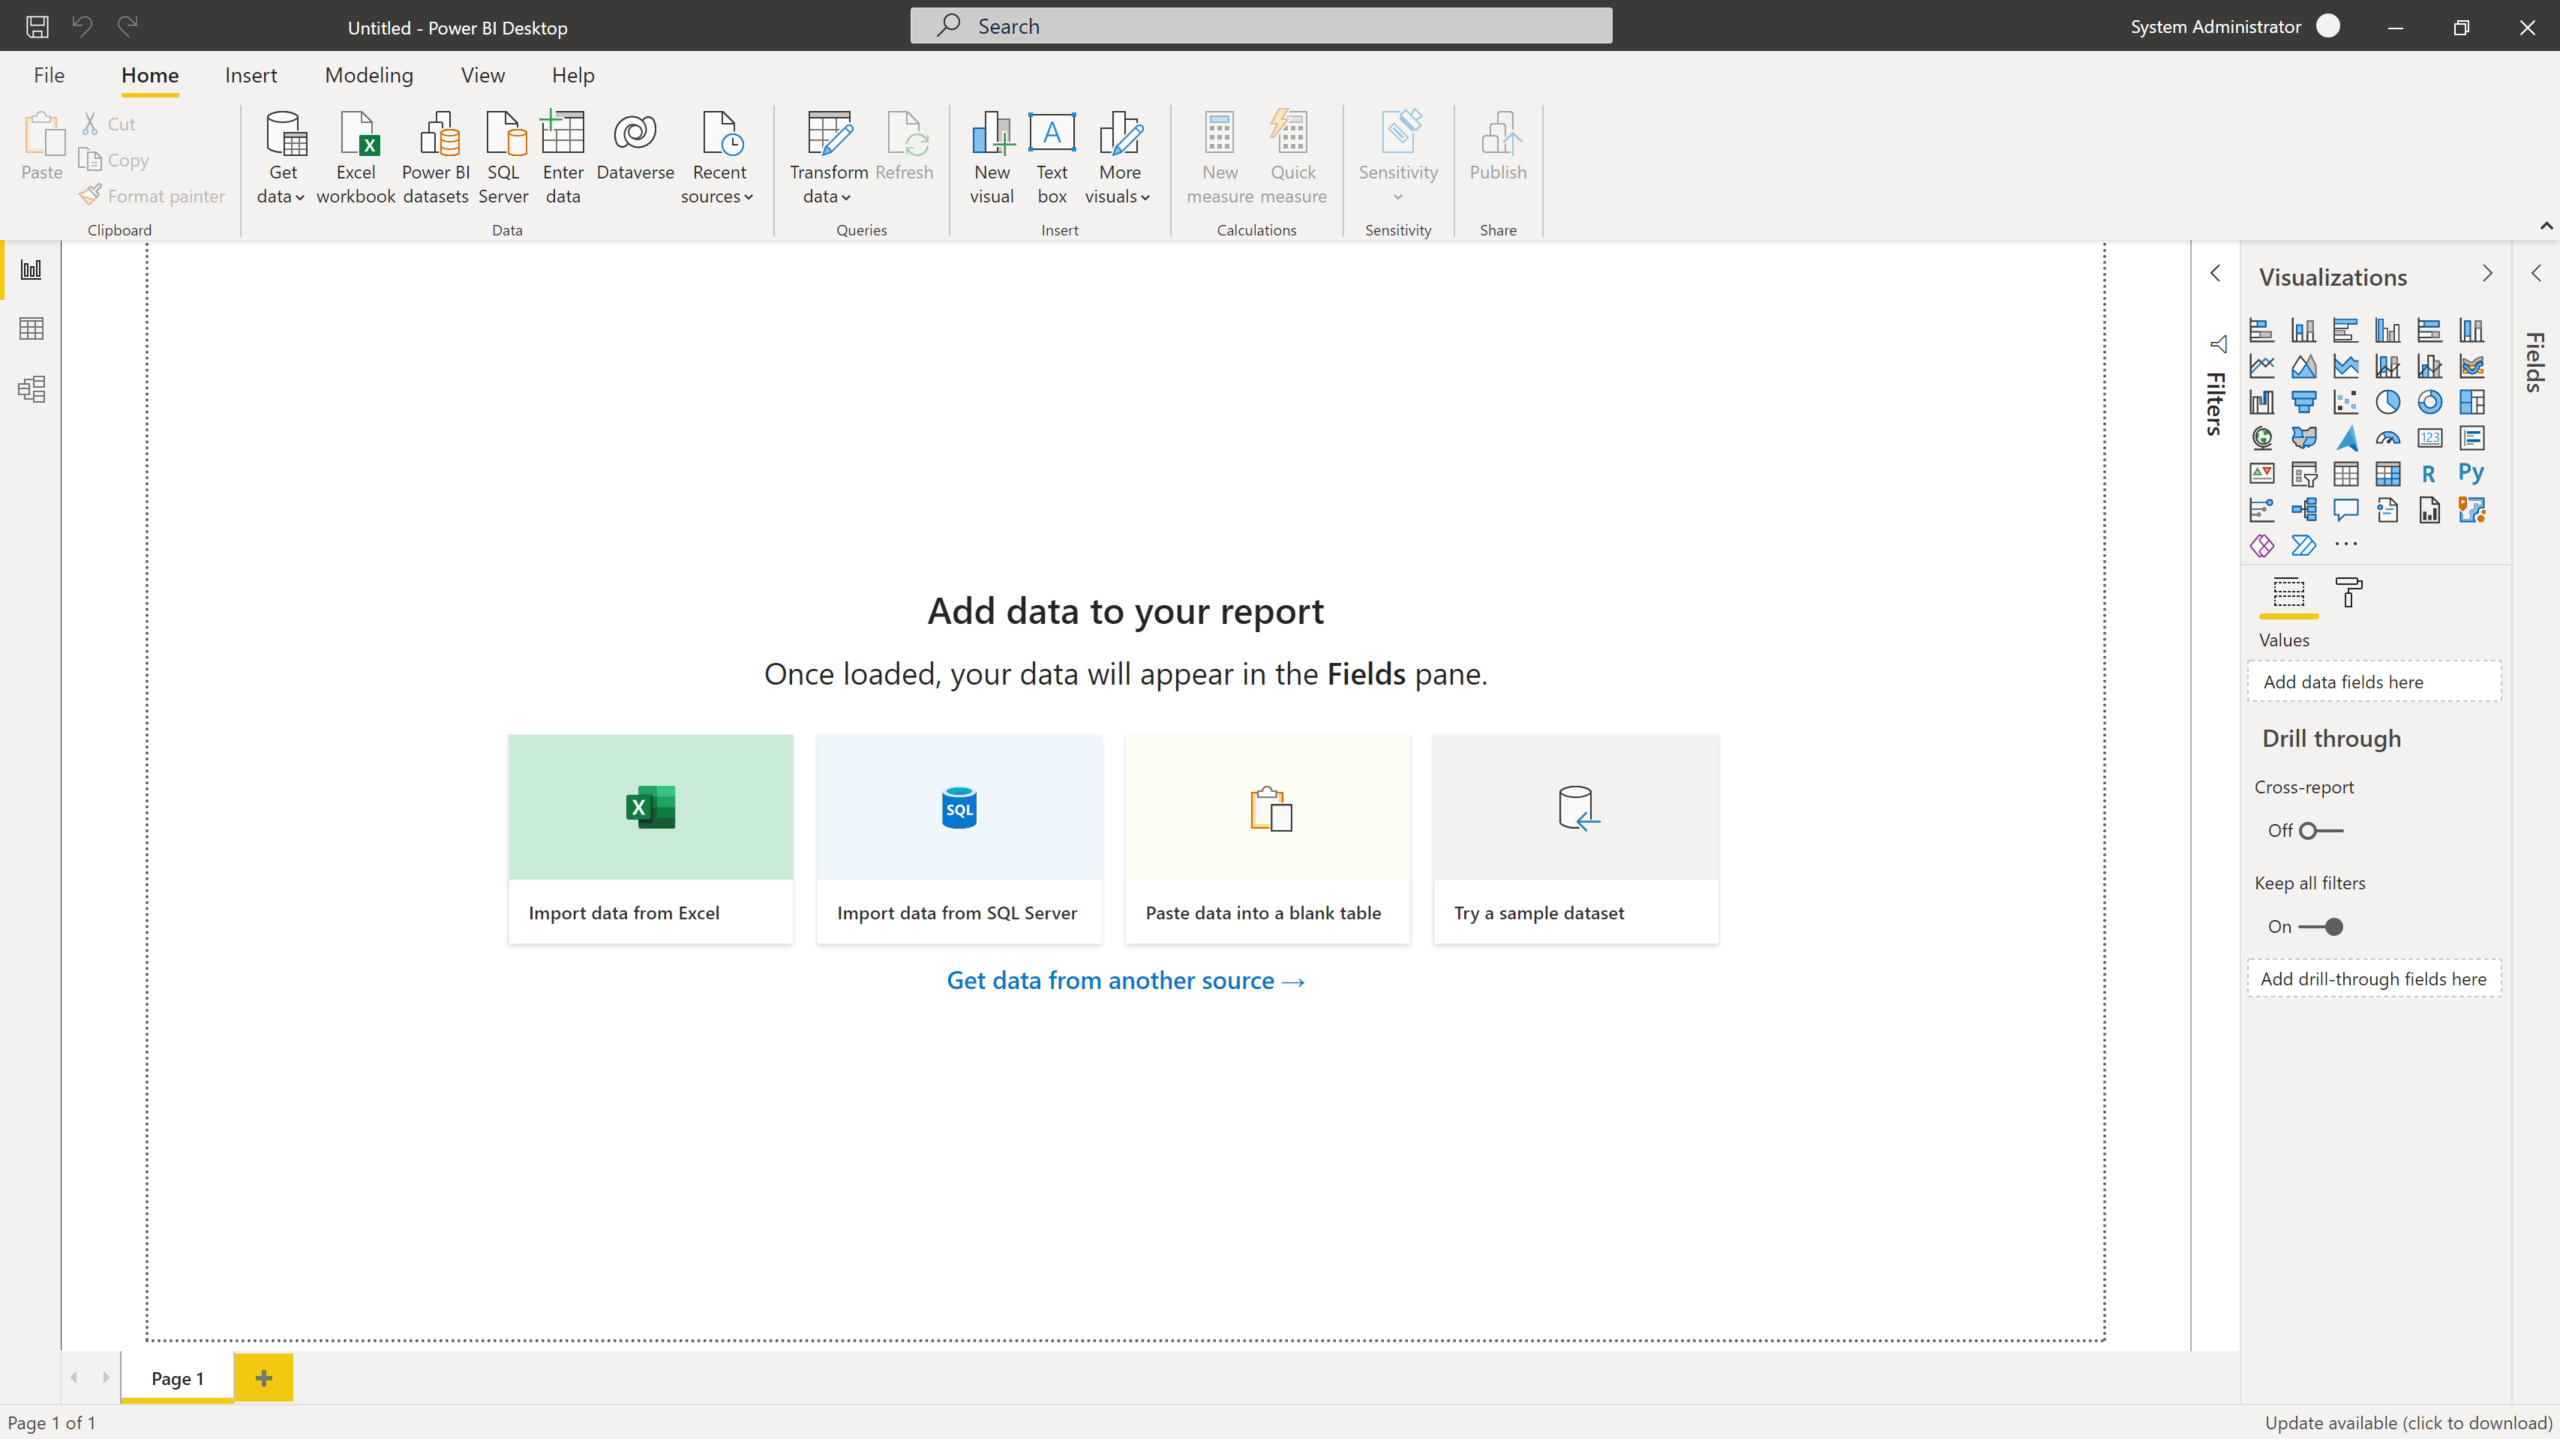
Next, the module provides a synthesis of processes for connecting to various data sources. Gaining access to the correct data source is a crucial step, followed by the art of cleaning and transforming the data.
Once the data is accessed, the next important step is to clean and transform the data to ensure its usability. This process is thoroughly elaborated within this module.
Key emphasis is laid on guiding participants on how to generate visualizations that are not only visually appealing but are also effective in communicating the insights derived from the data.
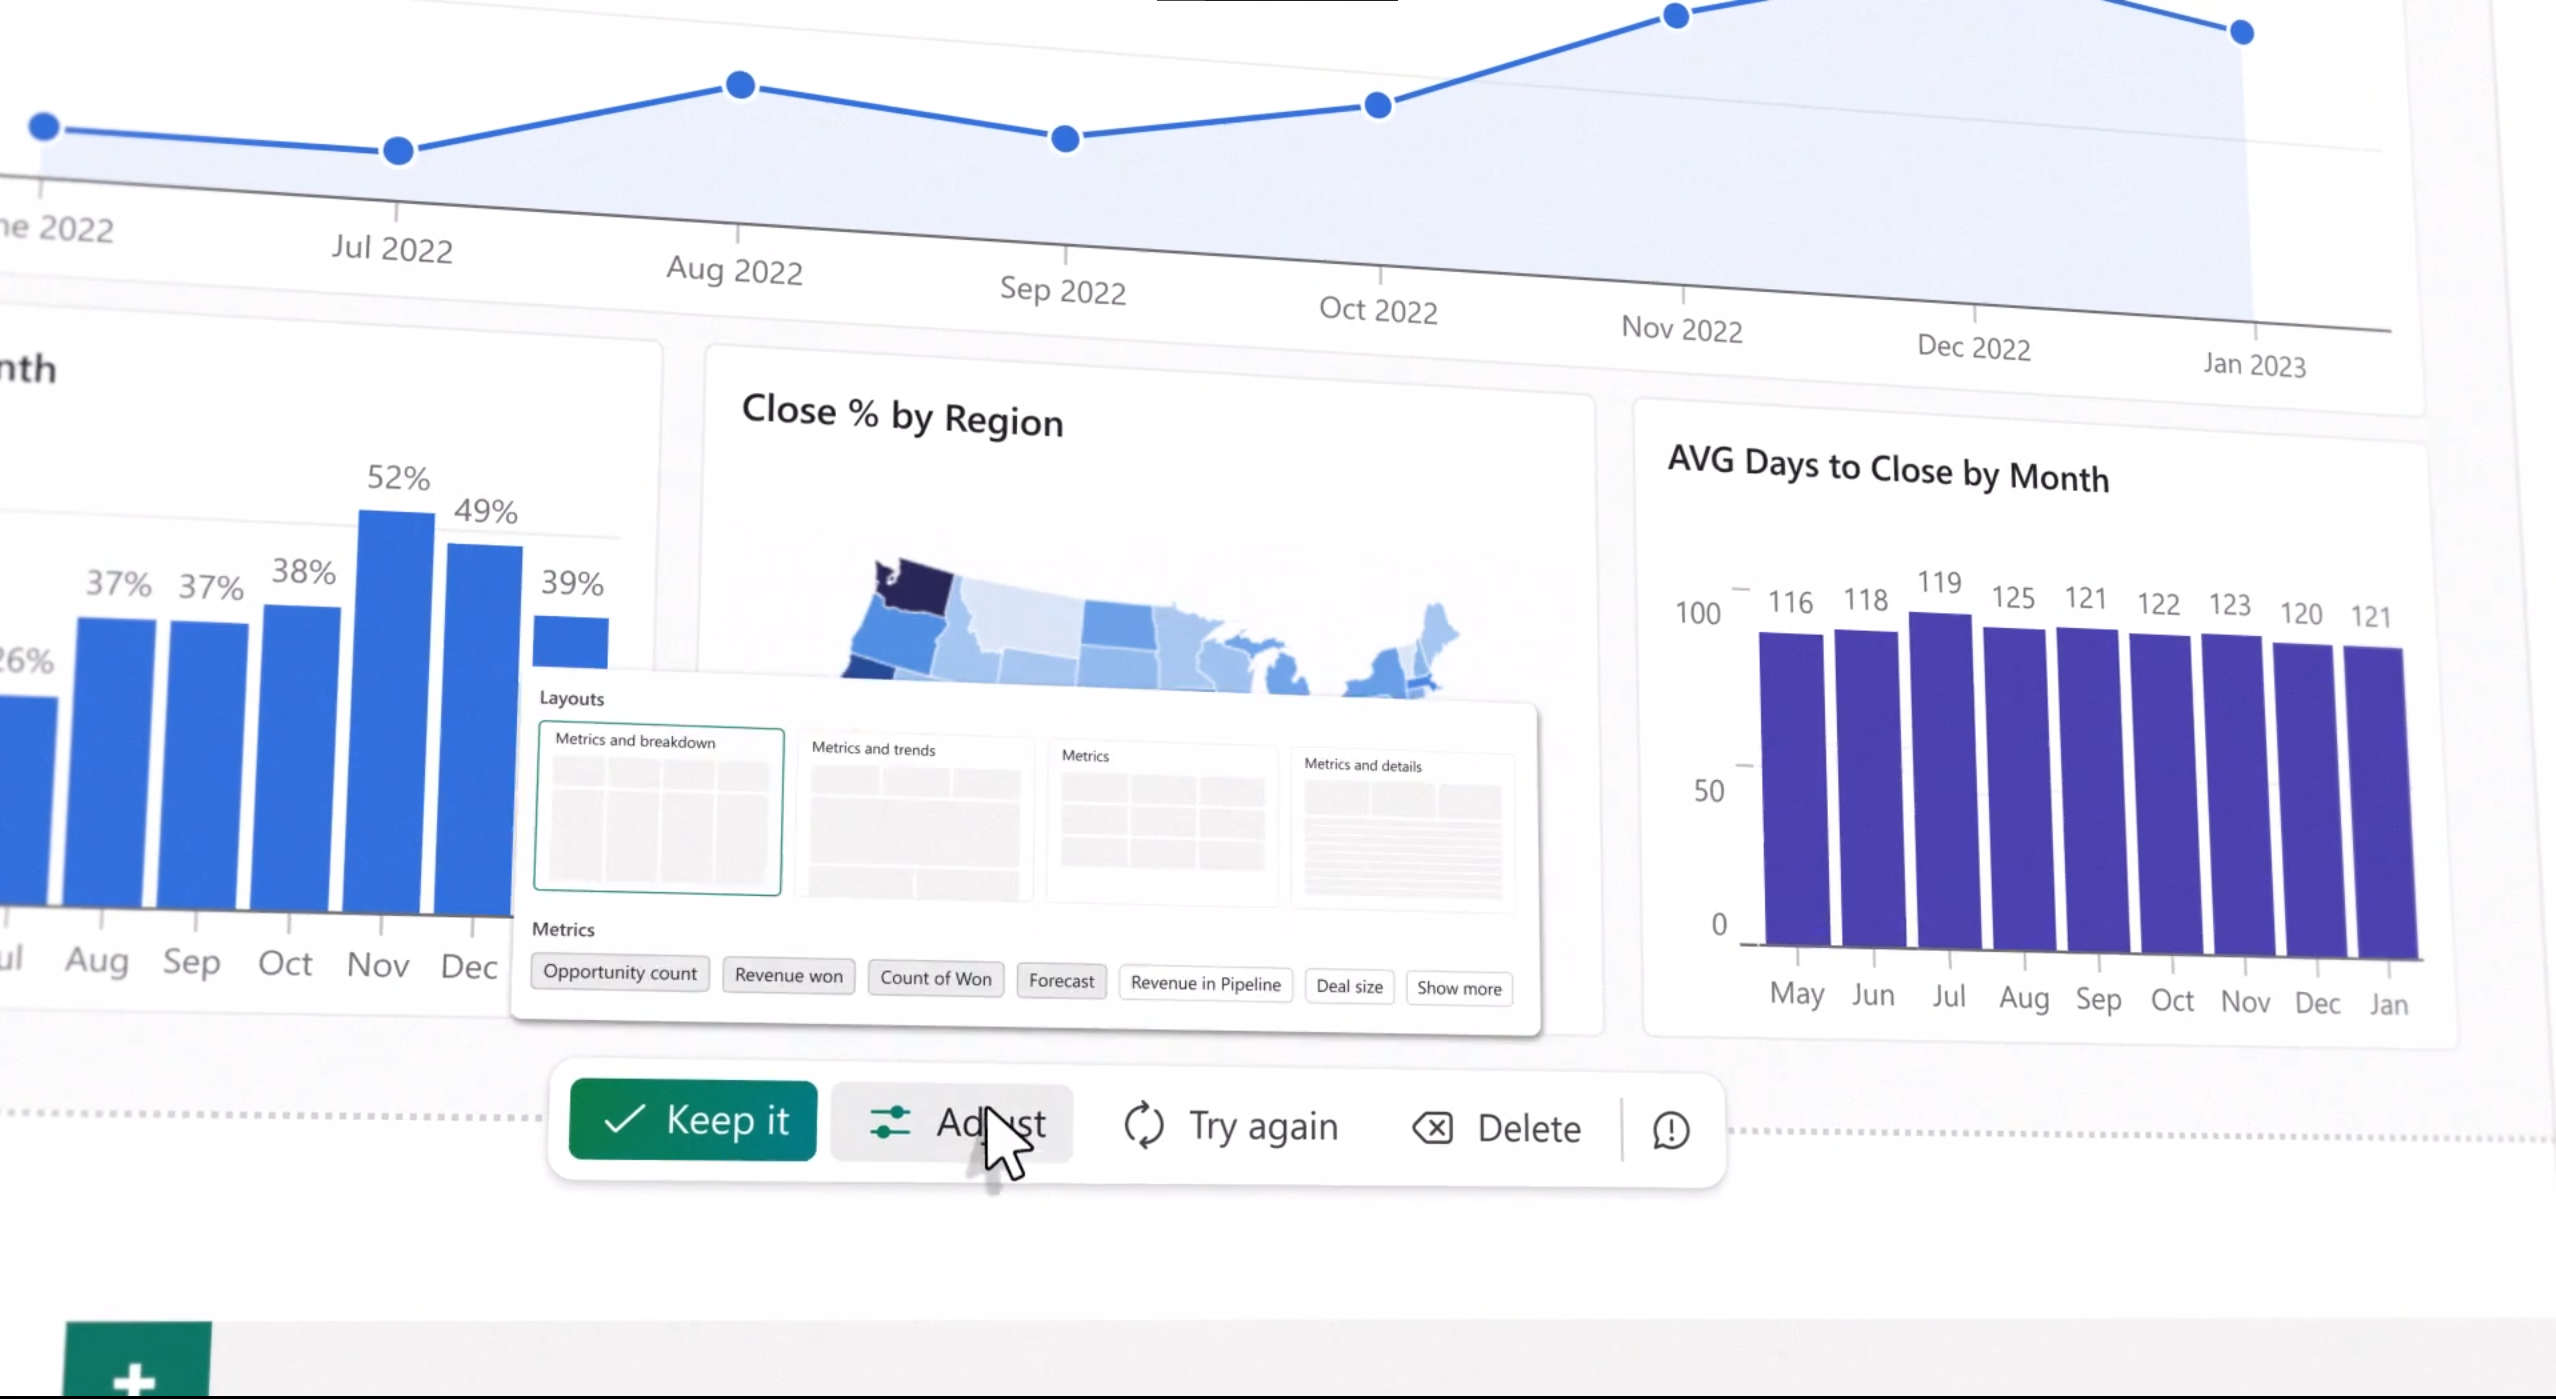
A range of visualization techniques like charts, graphs, maps, and tables are explored. This equips the learner to choose the right visualization method that best represents the data and clearly communicates the intended message.
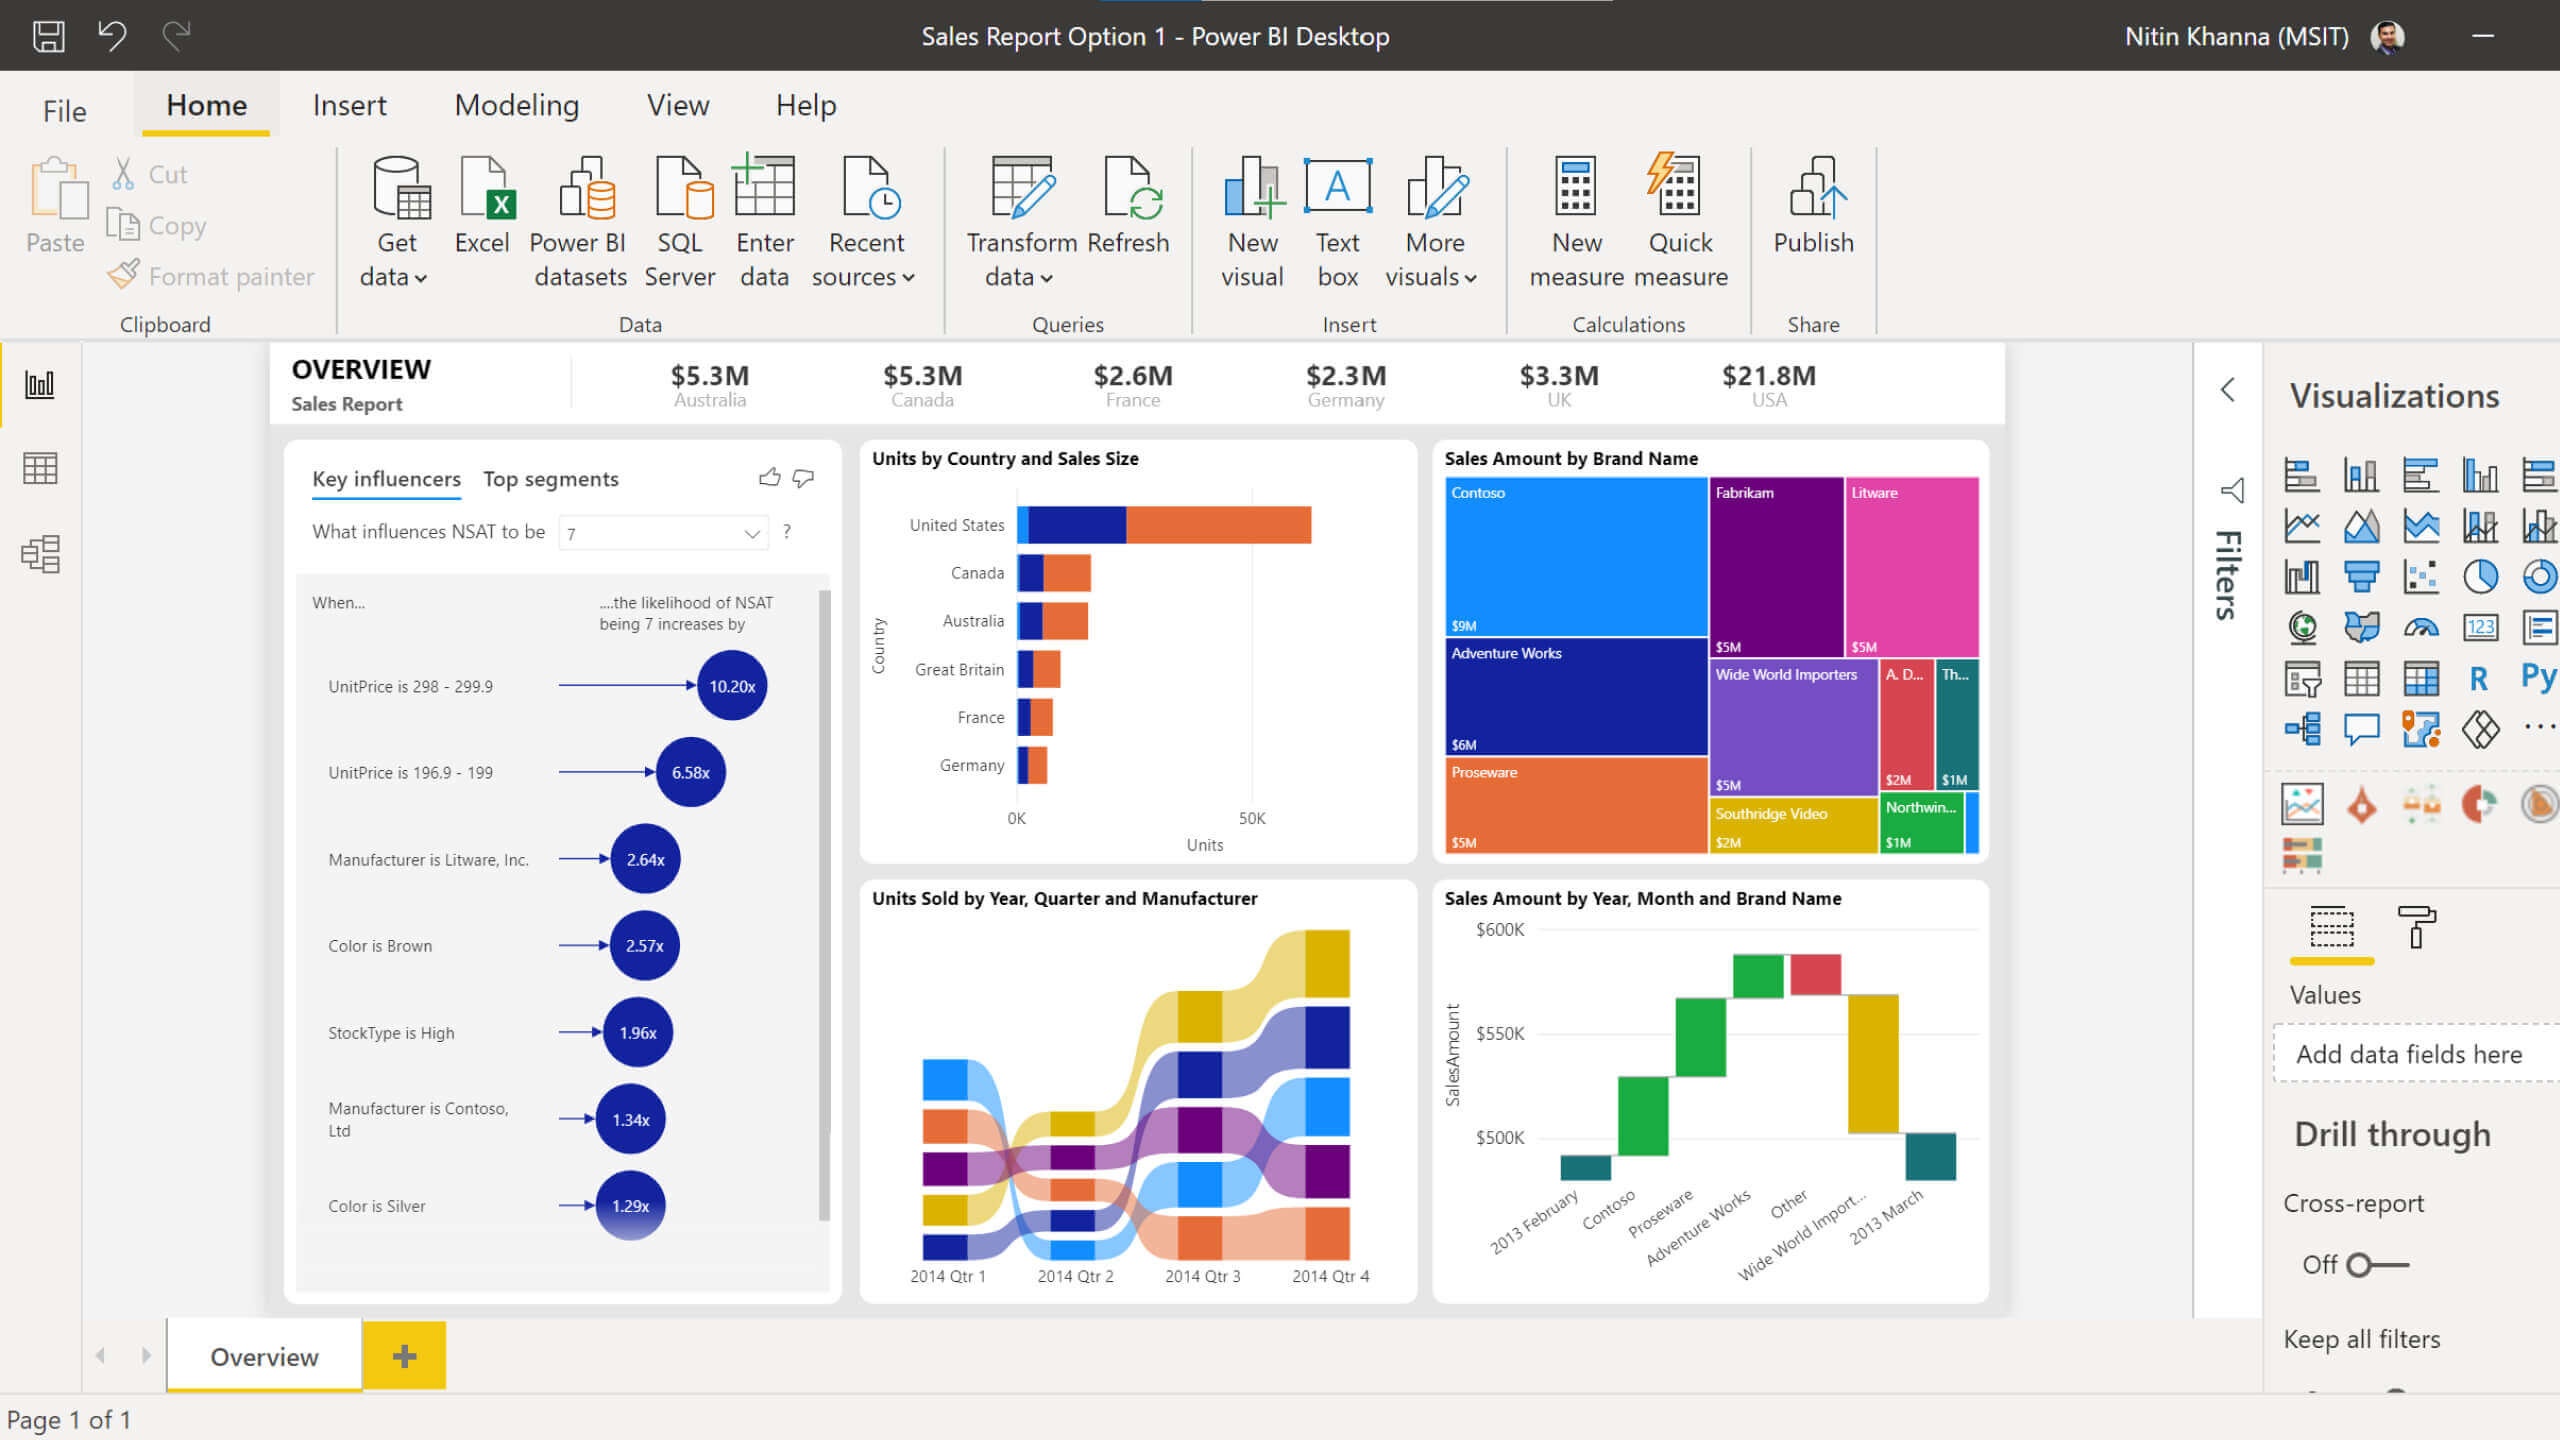
Beyond creating basic visualizations, the module teaches learners how to customize and format these visualizations. These skills are fundamental to optimize the visualizations for overall effectiveness.
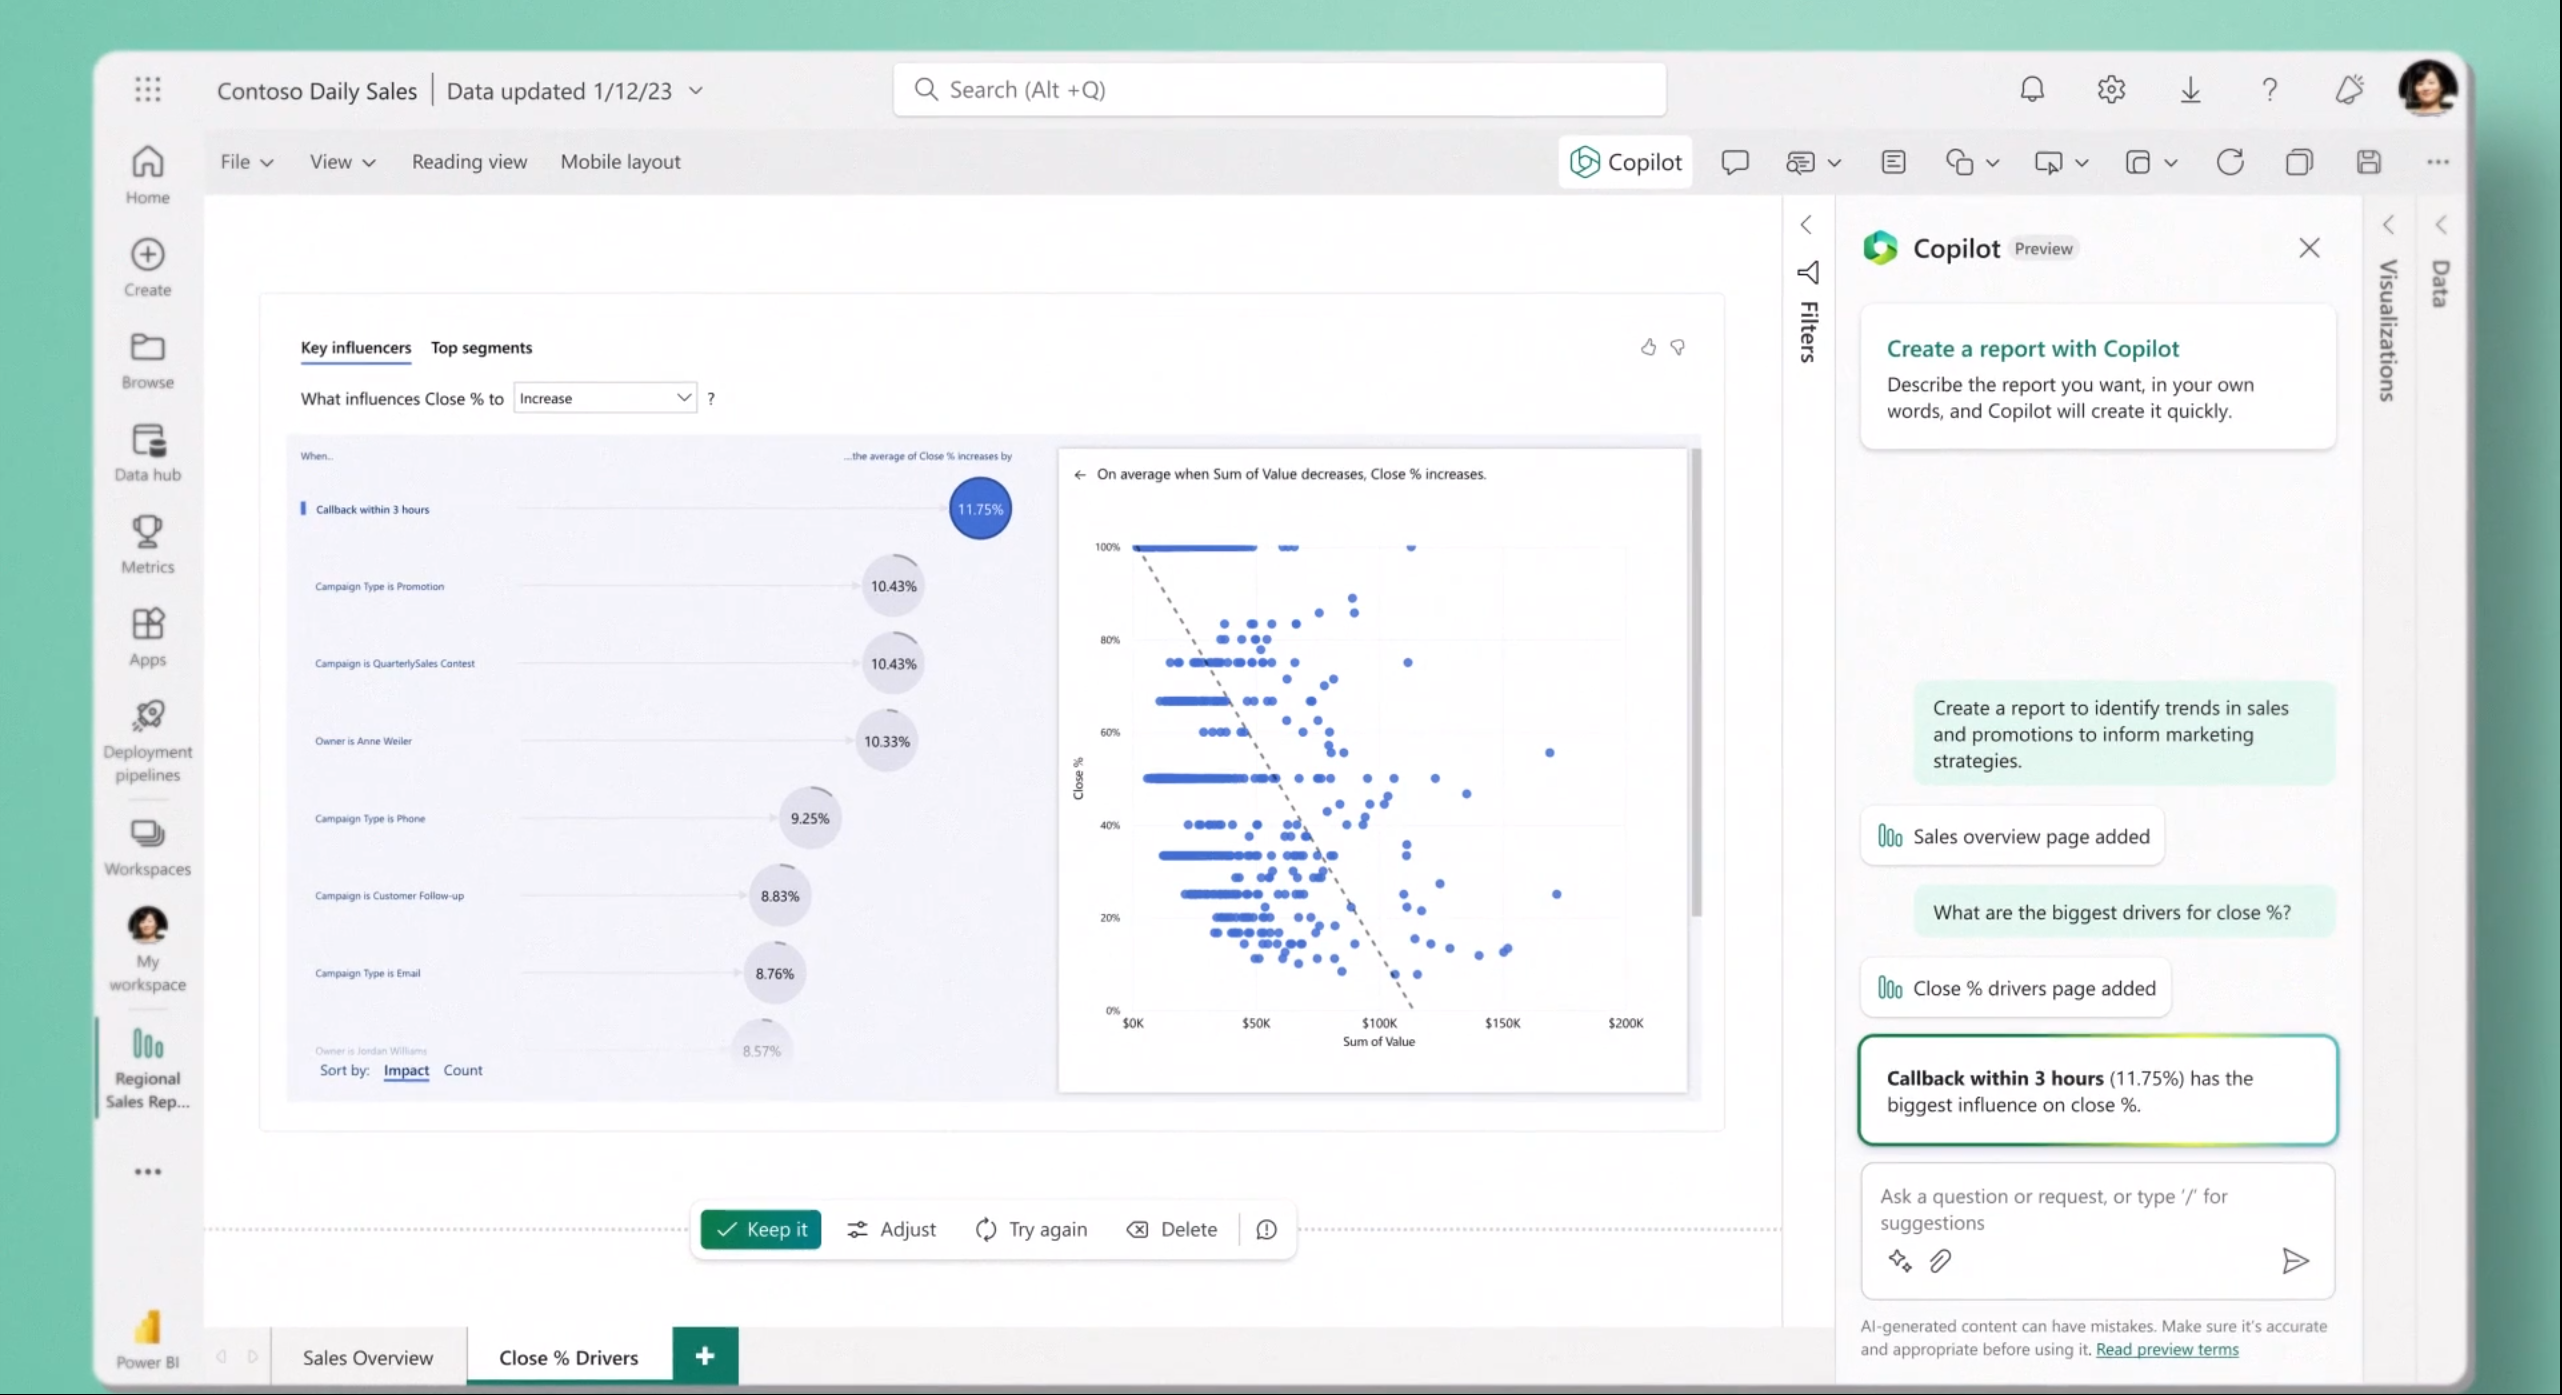
The module also trains on how to create interactive dashboards and reports. These allow the user to delve deeper into the data and gather more specific insights.
Next, learners are ushered through advanced data modeling techniques. These techniques allow for sophisticated data analysis, making the insights more refined and precise.
Lastly, the module covers how to collaborate and share these visualizations. It equips learners with skills to involve others in their data journey, enabling collaborative decision-making.
Although the module requires some basic familiarity with data analysis concepts and Microsoft Excel, there's no prior experience with Power BI required. However, having some preliminary knowledge would be advantageous.
Power BI allows users to connect to a wide range of data sources, enabling comprehensive data analysis and visualization.
With Power BI, users can easily clean and transform data, ensuring its usability for effective visualization.
Power BI offers a variety of visualization techniques, such as charts, graphs, maps, and tables, allowing users to create visually appealing and interactive visualizations.
Users can customize and format visualizations to optimize their effectiveness, making it easier to communicate insights derived from the data.
Power BI enables the creation of interactive dashboards and reports, providing users with the ability to explore data in-depth and gather specific insights.
Power BI allows users to collaborate with others and share visualizations, facilitating collaborative decision-making and knowledge sharing.
Power BI simplifies the process of analyzing data, allowing users to gain valuable insights and make data-driven decisions.
With Power BI, users can create visually appealing and interactive visualizations, making it easier to understand complex data and communicate insights effectively.
Power BI automates data transformation and visualization processes, saving time and reducing costs associated with manual data analysis.
Power BI enables users to connect to various data sources, making data more accessible and facilitating comprehensive analysis.
Power BI's collaboration features enable users to involve others in the data analysis process, fostering collaborative decision-making and knowledge sharing.
Power BI allows users to connect to real-time data sources, providing up-to-date insights and enabling timely decision-making.