No items found.
Transform complex data into visual representations. Utilize Tableau's data visualization capabilities to create charts, graphs, and maps that enhance data comprehension and reporting.
Talk to an Expert Tableau Data Visualization is a powerful tool that falls under the broader category of Data Visualization within the Data and Analytics Software umbrella. This module focuses on providing users with the necessary tools and features to effectively visualize data using Tableau, a leading software in the field.
Tableau offers a wide range of capabilities that enable users to connect various data sources, build interactive dashboards, and create insightful visualizations. By leveraging Tableau, users can explore data from multiple perspectives, uncover trends, and discover patterns and insights that may otherwise remain hidden within raw data sets.
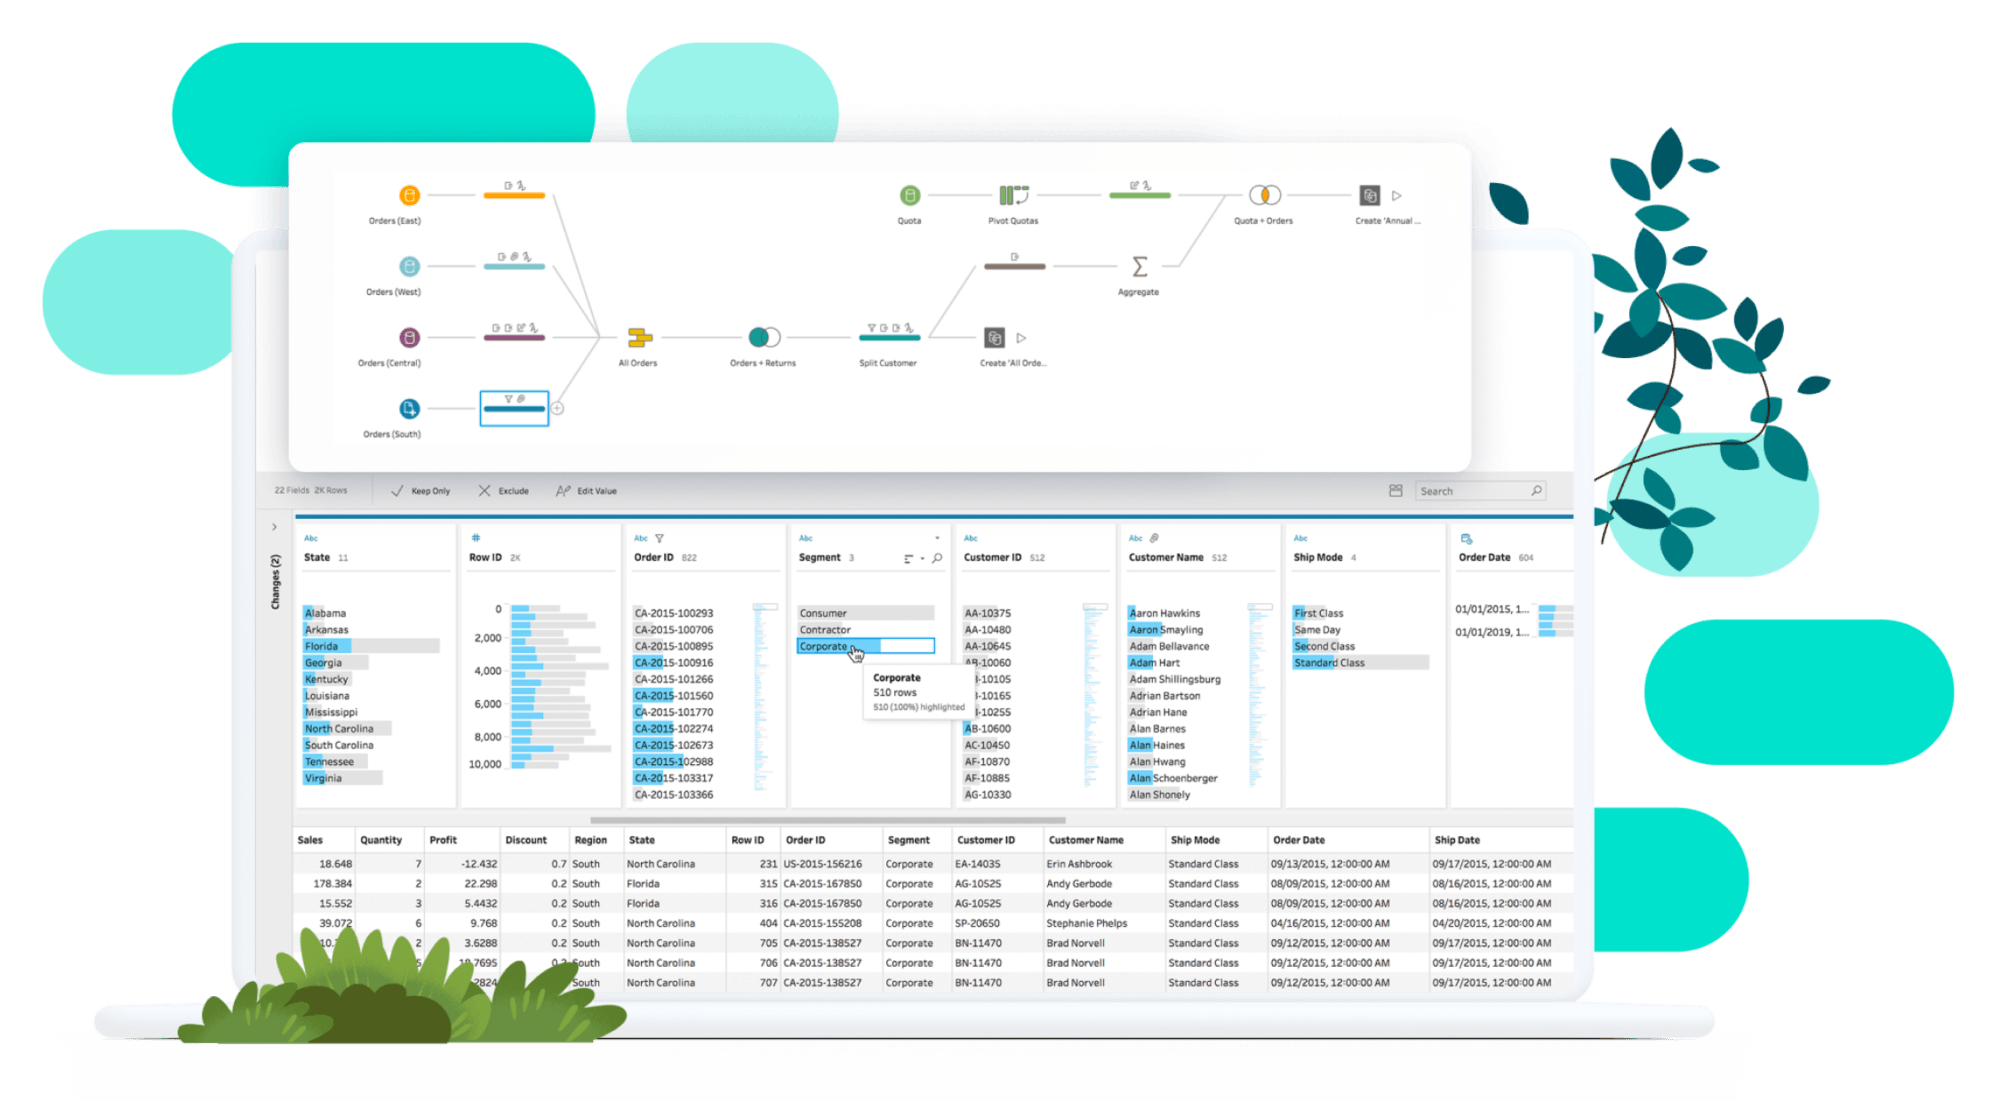
Tableau allows users to connect to various data sources, including spreadsheets, databases, and cloud services. This feature enables seamless integration of data from different platforms, making it easier to analyze and visualize information.
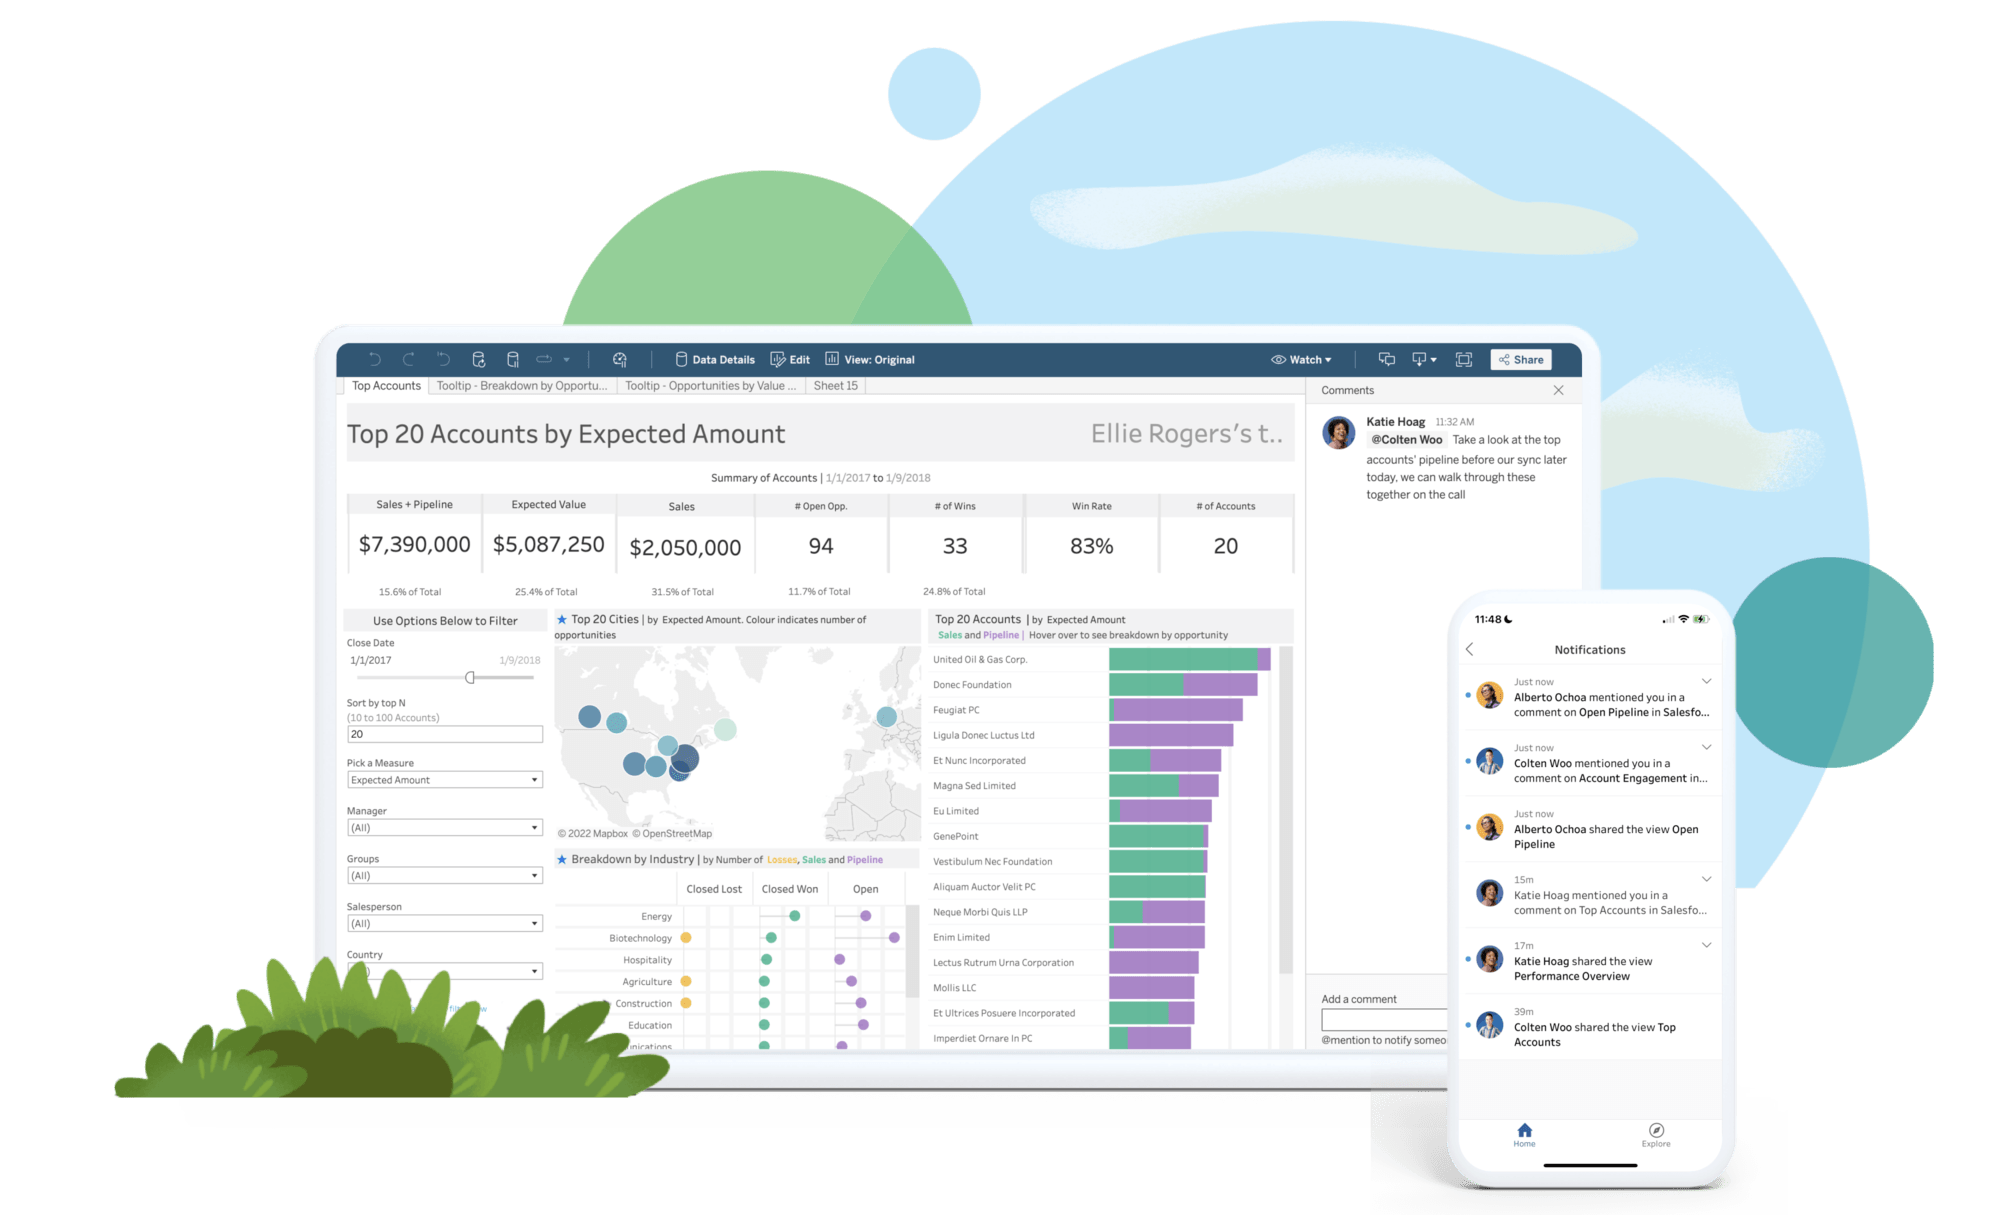
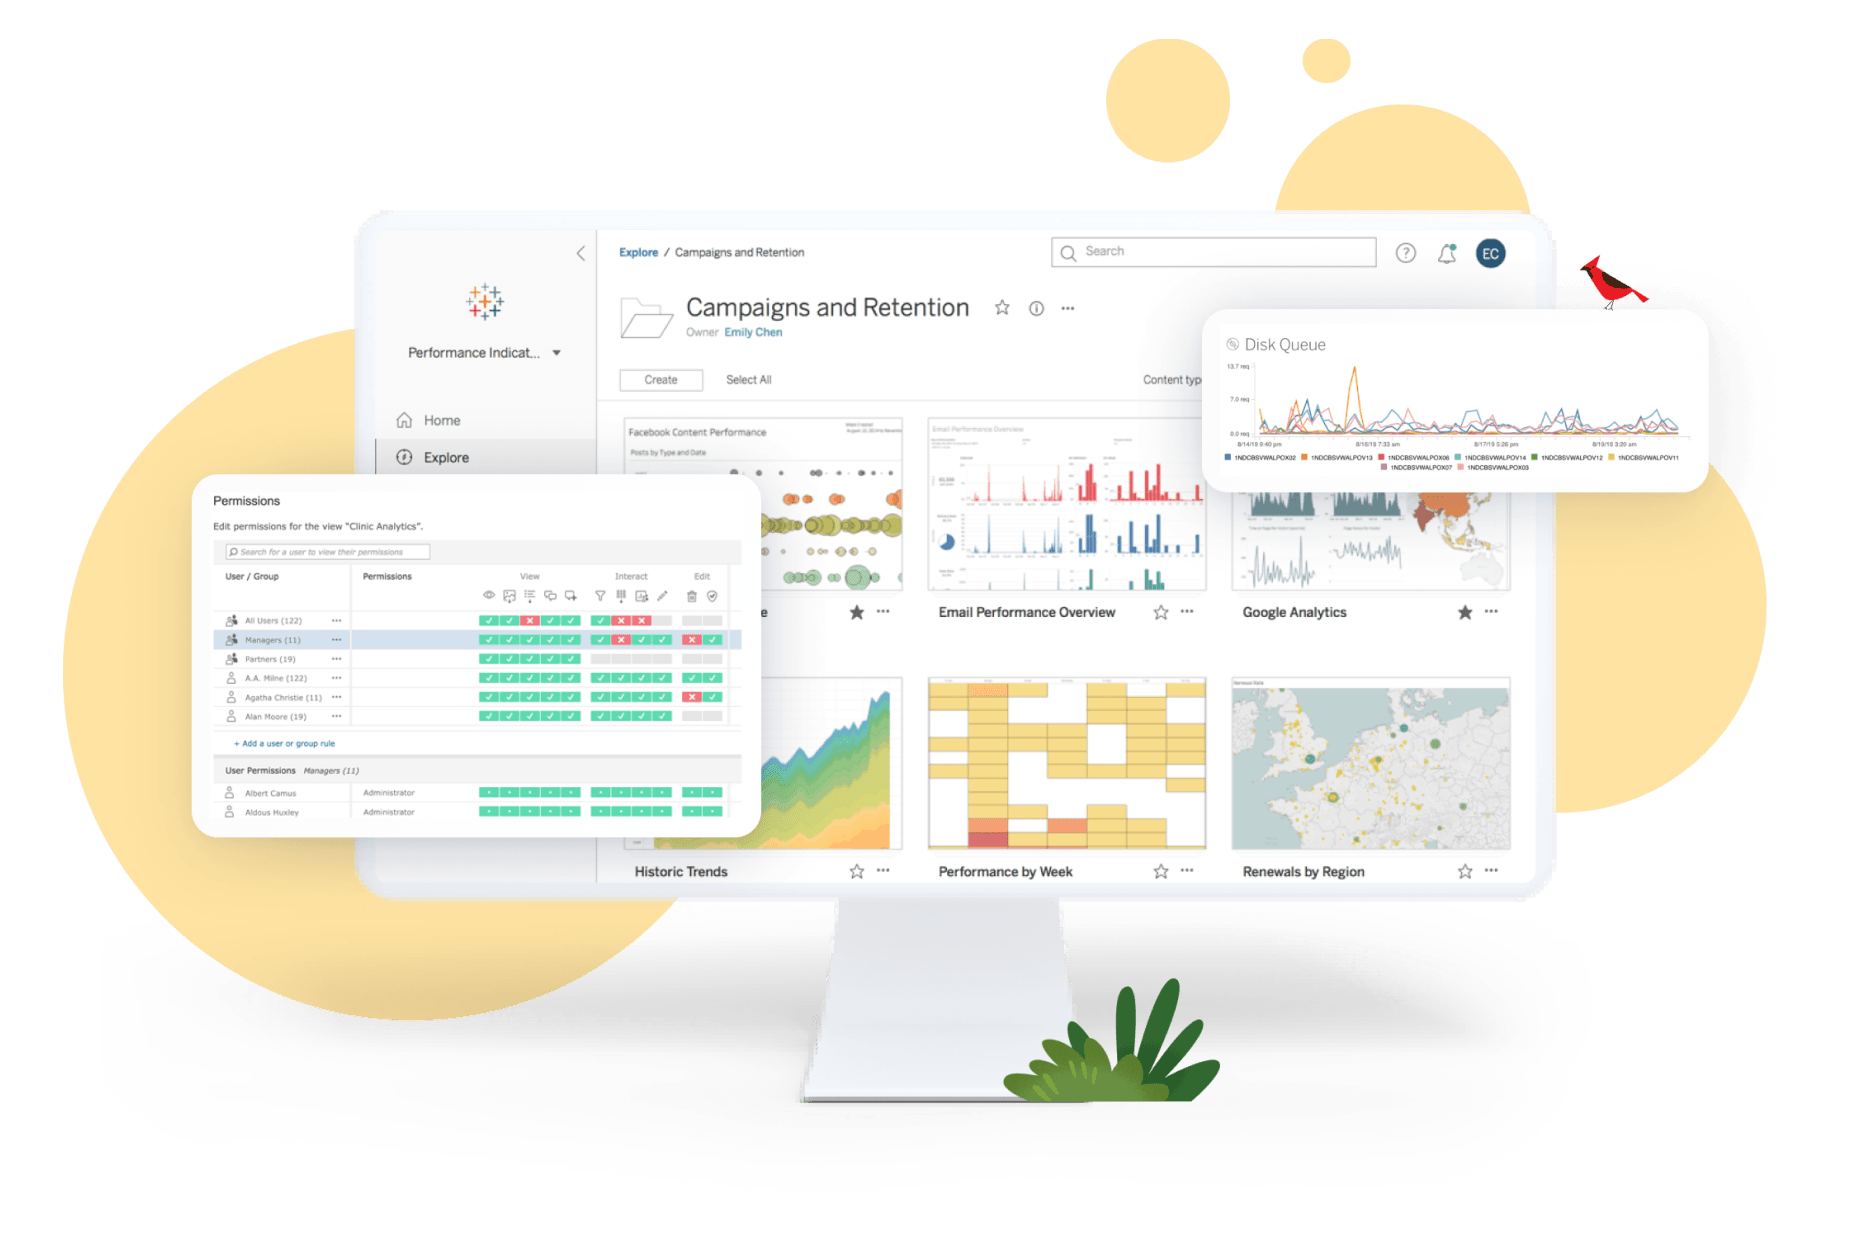
With Tableau, users can build interactive dashboards that provide a comprehensive view of their data. These dashboards can be customized to suit specific needs, allowing for easy exploration and analysis of data.
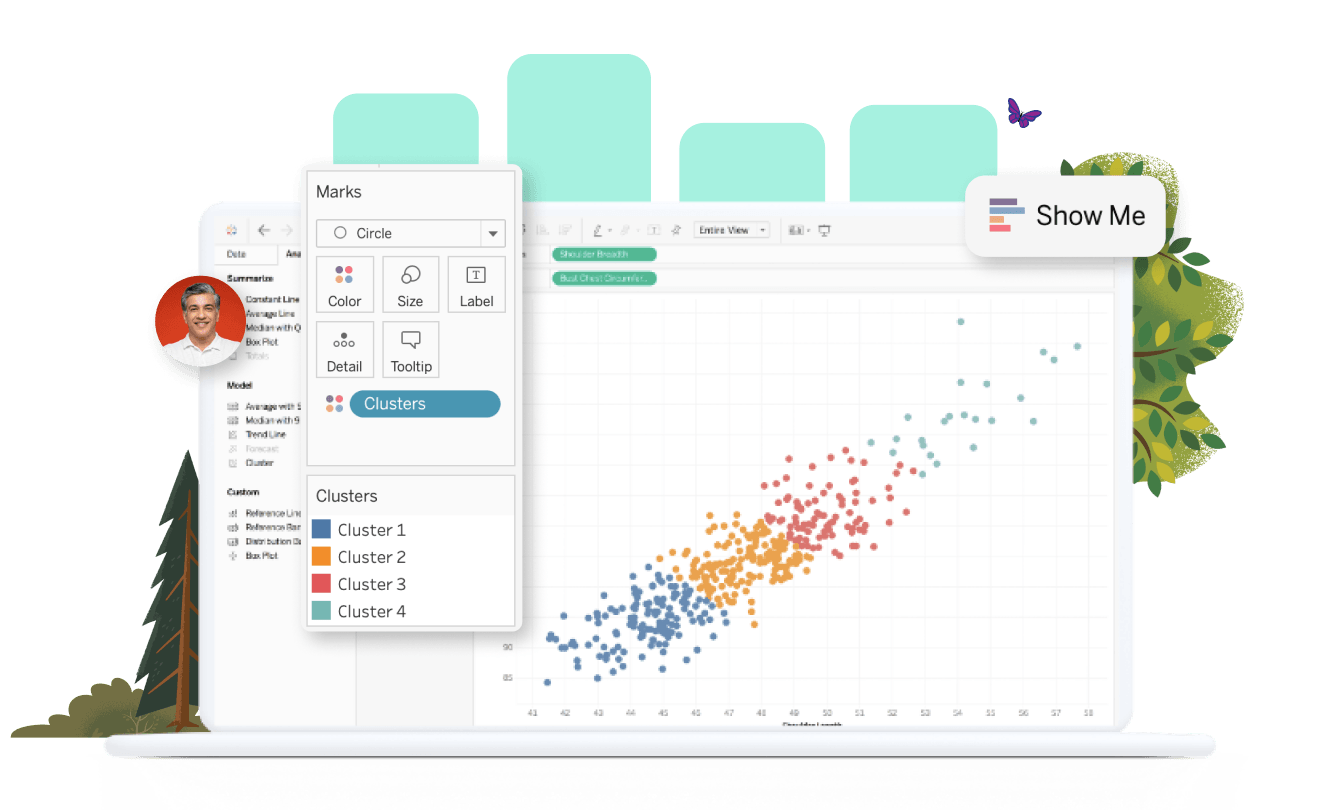
Tableau's intuitive drag-and-drop interface makes it simple to create visualizations. Users can easily drag data fields onto the canvas and choose from a wide range of visualization types to represent their data effectively.
Tableau's data blending feature allows users to combine data from multiple sources into a single visualization. This capability is particularly useful when dealing with complex data sets that require integration from various sources.
Tableau offers advanced analytics capabilities, including forecasting, clustering, and trend analysis. These features enable users to gain deeper insights into their data and make data-driven decisions.
Tableau provides collaborative features that allow users to share their visualizations with others. This promotes teamwork and facilitates knowledge sharing within an organization, leading to better decision-making processes.
Tableau's visualizations make it easier to understand complex data sets. By representing data visually, users can quickly identify patterns, trends, and outliers, leading to better insights and understanding.
With Tableau, users can make data-driven decisions based on accurate and up-to-date information. The ability to explore data from different angles and perspectives enables users to make informed choices that drive business success.
Tableau's intuitive interface and drag-and-drop functionality significantly reduce the time and effort required to create visualizations. This saves valuable resources and allows users to focus on analyzing data rather than struggling with complex software.
Tableau's collaborative features foster teamwork and knowledge sharing within organizations. Users can easily share visualizations, collaborate on projects, and provide feedback, leading to improved collaboration and better outcomes.
Tableau's visualizations simplify the communication of complex data to stakeholders. By presenting data in a visually appealing and easy-to-understand format, users can effectively convey insights and findings to a wider audience.
Tableau is a scalable solution that can handle large and complex data sets. It also offers flexibility in terms of data sources, allowing users to connect to various platforms and integrate data seamlessly.