Turning complex data into dashboards your team can actually read. But a dashboard is only as trustworthy as the data feeding it. We implement Tableau as part of your finance and operations stack, connecting it to NetSuite, Coupa, and your other source systems so the numbers on the dashboard match the numbers in the ledger.
Talk to a Tableau Advisor


Intel Footprint
Break down your data silos with an agile visualization engine that unifies scattered pipelines into interactive, real-time dashboards. Empower your leadership team to stop chasing spreadsheets and start making definitive, data-backed operational adjustments instantly.
01
A fully hosted, cloud-based analytics platform that does away with the need to manage servers or underlying infrastructure by connecting to your data, analyzing it using potent visual analytics, and securely sharing insights throughout the company.
02
Whether it is implemented natively on your own on-premises infrastructure or in a private or public cloud instance, this self-hosted analytics platform is designed to provide you complete control over your data and analytics deployment.
03
An open analytics platform that effortlessly integrates direct workflow integration, modular architecture, trusted data management, and sophisticated AI to transform unprocessed enterprise insights into faster, more intelligent business decisions.
04
A controlled, adaptable local environment that enables your data teams to swiftly identify and act upon intelligent business insights by exploring, modeling, and visualizing data at any time and from any location, even offline.
See how this would run across your actual source systems and dashboards.
Map Tableau to Your DataWhat We Deploy
01
The analytics layer is where raw data from your source systems becomes something a finance or operations leader can interpret. We design the data models, relationships, and calculated logic that turns transactional data from NetSuite, Coupa, and your other platforms into trended, comparable, decision-ready analyses.
02
The dashboard layer is what your team actually opens every morning. We build interactive dashboards designed around the decisions your finance, operations, and leadership teams need to make, with the metric definitions, filters, and drill-downs governed so that everyone is reading the same numbers the same way.
03
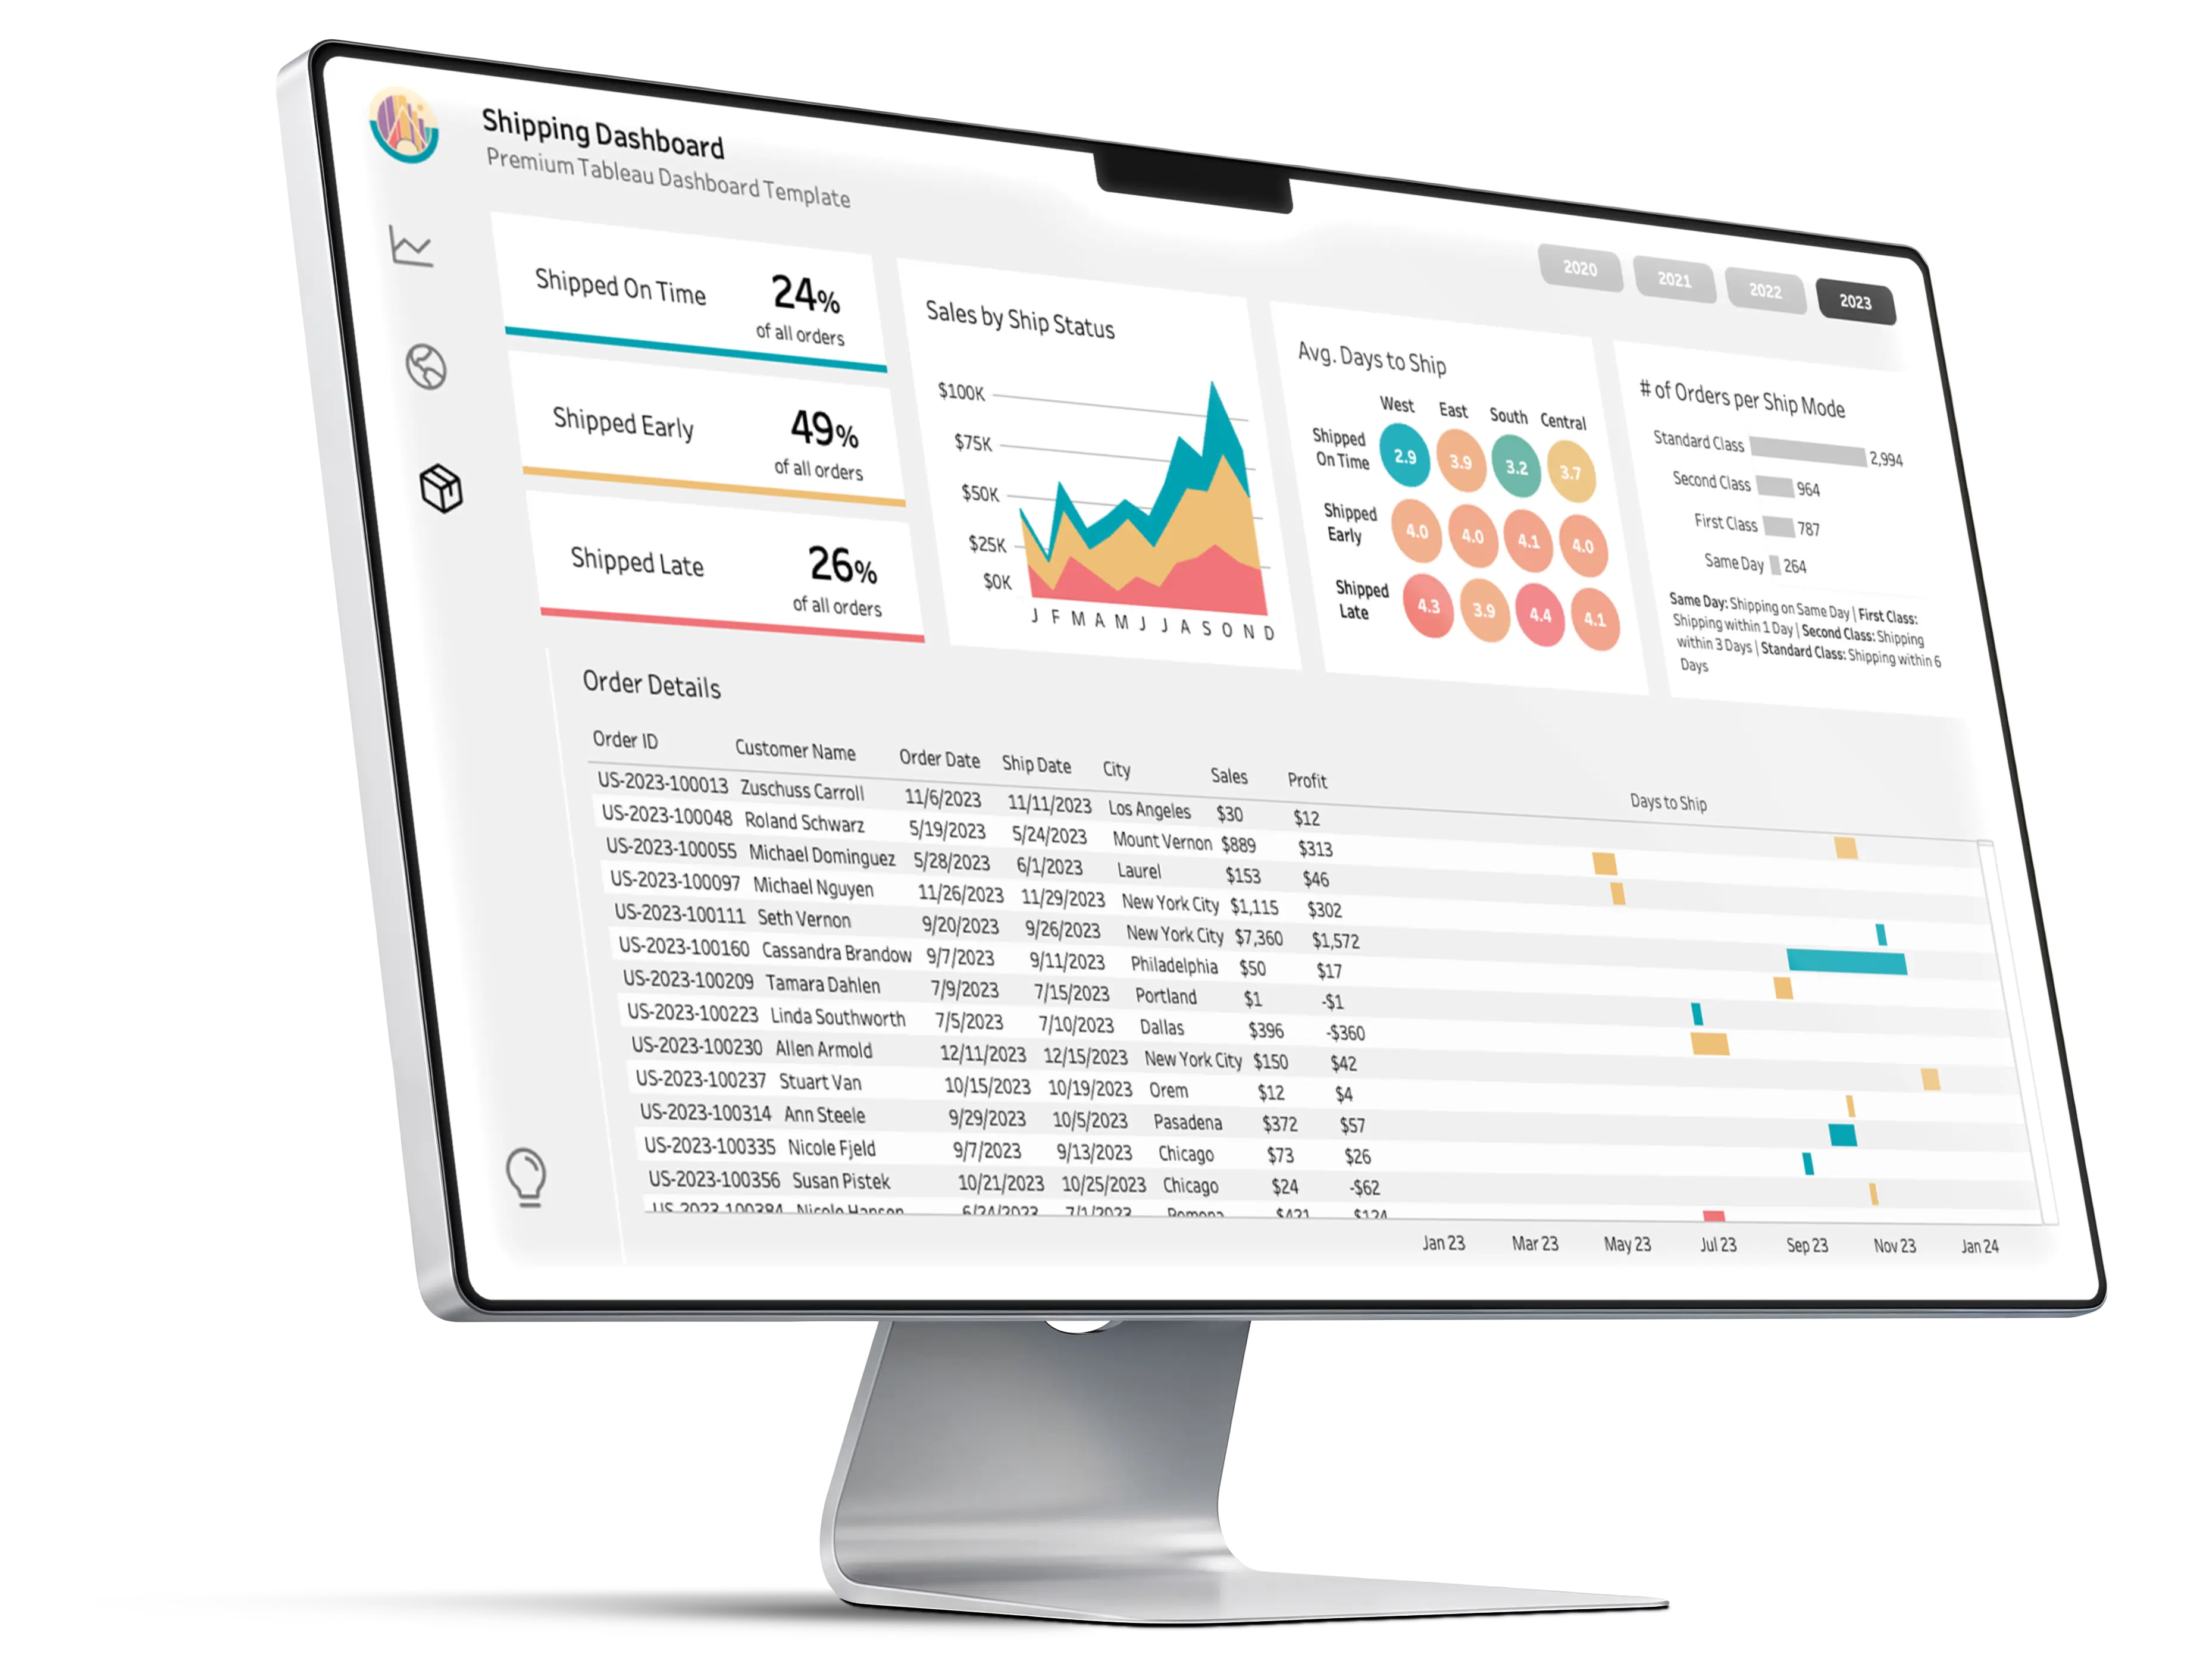
The visualization layer is the output: the charts, graphs, and maps that make complex data comprehensible at a glance. We design visualizations that communicate clearly rather than decoratively, choosing the chart type that actually fits the question being asked and building the reporting views that leadership can read in a board meeting without a data analyst translating.
See how this would run across your actual source systems and dashboards.
Map Tableau to Your DataZanovoy’s Advantage
Most Tableau implementation work is done either by general BI shops who know visualization but not your finance stack or by data contractors who build something impressive and leave before anyone has to maintain it.
We monitor your Tableau environment and the data pipelines feeding it so that broken connections, stale extracts, and refresh failures get caught before someone makes a decision on bad data. Coverage extends through the reporting windows that matter most, including close cycles and board-reporting periods.
We help you scope the right Tableau footprint, including Tableau Desktop, Tableau Cloud or Server, and Tableau Prep, with clear pricing and an onboarding path grounded in how your team actually works rather than against a generic deployment template.
Because we already understand the source systems your data comes from, we move faster through the part of a Tableau project that usually stalls: the data modeling and integration layer. Time-to-first-trusted-dashboard lands at a predictable milestone rather than at an aspirational date that keeps slipping.
The same team that implements and supports your NetSuite, Coupa, and finance stack also builds and maintains your Tableau layer. When the dashboard disagrees with the ledger, you do not coordinate between your ERP partner and your BI vendor. One team owns both ends of the pipeline.
We do not stop at the first dashboard. We govern the metric definitions, manage dashboard proliferation, refine the data model as the business evolves, and keep the reporting layer aligned with the source systems as they change. The Tableau environment matures with the business rather than fragmenting as it grows.
The team that runs your NetSuite and Coupa stack builds your Tableau layer, so the dashboard and the ledger agree.
Get Your Tableau Setup ScopedProfessionals on the Financial Transformation Team
Companies supported through IPO
Implementations delivered across 5 continents
Customizations built for enterprise clients
Integrations built across the platform ecosystem
Continents served
Enterprise Visual Intelligence
Optimize your data with interactive, self-service dashboards that eliminate administrative silos. Equipping every department with accessible, real-time metrics allows your entire organization to make swift, confident, and data-backed operational adjustments.
01
Accelerate your digital transformation by tapping into a global network of millions of data experts. The extensive Tableau Community provides a direct line to shared insights, continuous learning, and collaborative problem-solving, ensuring your team has the support to grow regardless of where you are in your analytics journey.
02
Deploy flexibly in the cloud, on-premises, or via native Salesforce CRM integration. The platform unifies your entire data landscape with deeply integrated AI/ML capabilities, enterprise-tier governance, robust data management, and visual storytelling tools built for cross-functional collaboration.
03
Business intelligence should be about interrogating metrics, not fighting with software complexity. Built around visual best practices, Tableau enables limitless data exploration and rapid drill-downs without disrupting your strategic momentum, making it a platform your teams will actually love to use.
04
Scale your analytics footprint broader and faster than ever before. As a trusted implementation partner, Tableau enables organizations to drive continuous innovation, streamline complex operations, and maximize the tangible ROI of their financial and data infrastructure investments by fostering a true, data-backed culture.
Testimonials


© Copyright 2025, All Rights Reserved by Zanovoy


.png)